If you have been benching every quarterback and wide receiver the moment the wind picks up, the data through 2024 says the scoring hit at those positions is too small and too noisy to act on. The positions where windy games actually show a supported scoring decline are tight ends and kickers.
The study compares NFL regular-season games with observed winds of at least 15 mph against games below 10 mph, using combined home-plus-away fantasy scoring for each position group. That means each number is the total PPR points both teams' quarterbacks (or running backs, wide receivers, tight ends, or kickers) produced in a game, so a smaller number means the whole position group scored less, not that one player slumped. The sample covers 101 windy games and 806 calm-wind games through the 2024 season, with adjustments for week, season, temperature, and which teams were playing.
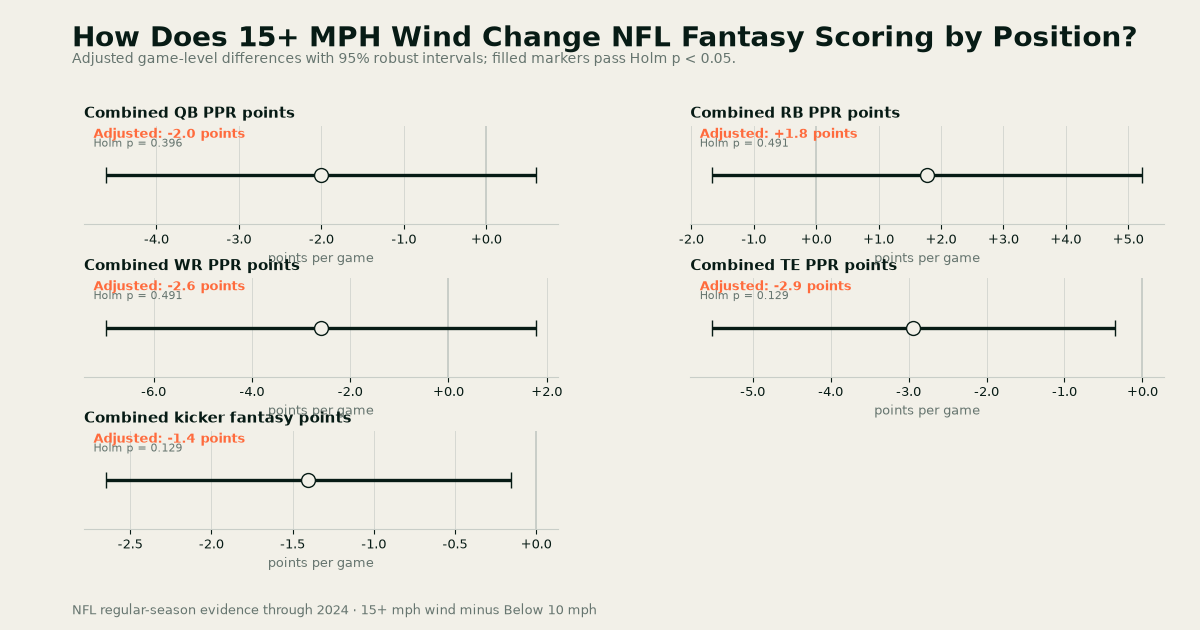
Two position groups show a supported difference. Combined kicker fantasy points averaged 13.9 in 15+ mph wind games versus 16.0 in below-10-mph games; the adjusted change was -1.4 points with a 95% interval from -2.7 to -0.2 points and a Holm-adjusted p-value of 0.129. Combined TE PPR points averaged 22.4 versus 24.7; the adjusted change was -2.9 points with a 95% interval from -5.5 to -0.4 points and the same Holm-adjusted p-value of 0.129. The Holm adjustment is a correction for testing five position outcomes at once, so these p-values already account for the multiple comparisons; the intervals exclude zero, but the adjusted p-values sit above the conventional 0.05 threshold, which is why the evidence is best read as a consistent negative signal rather than a certainty.
The passing-game story you might expect is not supported here. Combined QB PPR points averaged 31.6 in windy games versus 33.8 in calm games, an adjusted change of -2.0 points with a 95% interval from -4.6 to +0.6 points and a Holm-adjusted p-value of 0.396. Combined WR PPR points averaged 63.0 versus 68.5, an adjusted change of -2.6 points with a 95% interval from -7.0 to +1.8 points and a Holm-adjusted p-value of 0.491. Both intervals cross zero, so the apparent declines could plausibly be noise. Running backs actually trend the other way: combined RB PPR points averaged 46.9 in windy games versus 45.0 in calm games, an adjusted change of +1.8 points with a 95% interval from -1.7 to +5.2 points and a Holm-adjusted p-value of 0.491 — a hint that ground games may pick up slack, but again the interval includes zero.
| Outcome | 15+ mph wind | Below 10 mph | Adjusted change | 95% interval | Holm p |
|---|---|---|---|---|---|
| Combined QB PPR points | 31.6 | 33.8 | -2.0 points | -4.6 points to +0.6 points | 0.396 |
| Combined RB PPR points | 46.9 | 45.0 | +1.8 points | -1.7 points to +5.2 points | 0.491 |
| Combined WR PPR points | 63.0 | 68.5 | -2.6 points | -7.0 points to +1.8 points | 0.491 |
| Combined TE PPR points | 22.4 | 24.7 | -2.9 points | -5.5 points to -0.4 points | 0.129 |
| Combined kicker fantasy points | 13.9 | 16.0 | -1.4 points | -2.7 points to -0.2 points | 0.129 |
The pattern in the table is directionally coherent: every passing-adjacent group and kickers score less in windy games, while running backs score slightly more. But magnitude matters for fantasy decisions. A -2.0-point adjusted change spread across both teams' quarterbacks is roughly one point per side, and the interval stretches well past zero. The kicker decline of -1.4 combined points is the most precise estimate in the study, and the tight end decline of -2.9 combined points is the largest supported gap.
One boundary matters for how you use this. These are retrospective associations from observed game-window wind readings, not a test of whether a pregame forecast improves your projections. Wind that was actually blowing during a game cannot be known beforehand with the same precision, and the study does not claim that wind causes the scoring changes or that any individual player should be benched in a forecast. What it does establish is which position groups historically moved most when games were played in 15+ mph wind — and the answer is tight ends and kickers, not the quarterbacks and receivers the wind narrative usually targets.
METHODS · SOURCES · REVIEW TRAILOpen the Research File+
QUESTION
Across quarterbacks, running backs, wide receivers, tight ends, and kickers, which position groups change most in NFL games with observed wind of at least 15 mph?
METHOD
- Registered comparison of NFL regular-season games with observed wind of at least 15 mph versus below 10 mph, using combined home-plus-away position-group scoring as the outcome.
- Sample: 101 condition games and 806 control games through the 2024 NFL season; 907 comparable games total, meeting the preregistered minimums of 100 condition games and 750 comparable games.
- Adjustments: week and season fixed effects, air temperature, and home- and away-team fixed effects, without adjusting away the defining wind exposure.
- Uncertainty: 4,000 game-level bootstrap draws and HC3 robust OLS intervals; Holm correction applied across the five preregistered position outcomes.
- Denominators reconciled per outcome; all 907 comparable games have defined QB, RB, WR, TE, and kicker scoring.
- Data: nflverse schedules, play-by-play, and weekly player statistics (CC BY 4.0); NOAA Global Hourly stadium observations (public domain); Wikidata stadium coordinates (CC0), used only to select and audit nearby weather stations. Weather data run through 2024, the latest available source season.
- Reproducibility: deterministic bootstrap seeding via SHA-256-derived seed labels; two complete analysis executions produced identical result hashes.
- Limitations: retrospective association only; observed postgame conditions are not a pregame forecast input; no causal claims; game-level results do not translate into individual player sit/start rules.
LIMITS
- These estimates are associations from observed game conditions, not causal effects.
- Observed game-window wind cannot be used as a pregame projection feature; this study does not evaluate forecast value.
- Combined home-plus-away scoring means results describe position groups, not individual players.
- QB, RB, and WR differences are null results: their 95% intervals include zero and Holm-adjusted p-values are 0.396 or 0.491.
- TE and kicker intervals exclude zero, but Holm-adjusted p-values of 0.129 exceed the conventional 0.05 threshold.
SOURCES
- nflverse NFL schedules, play-by-play, and weekly player statisticsCC BY 4.0
SHA-256 968c9f8a588b385231fd9a411a63167b35de4f6d14da1fa6efaaf2a47fd4dbaf - NOAA Global Hourly stadium observationsUS Government work; NOAA data are generally public domain
SHA-256 066a8418d7341118c7d34028997dbe39a77e2725349cf89883c5f576bf248658 - Wikidata stadium coordinatesCC0 1.0
SHA-256 ac17d4b5ea72b31f0c127cf570a79f961370090bb090864710fd34c17312afd4
DOWNLOADABLE DATA
REVIEW TRAIL
Statistics and figures come from deterministic code. The Research File contains the registration, provenance, specialist reviews, and gate decision.