No. Dome and closed-roof games average more combined points than outdoor games in raw terms (48.3 vs 44.8), but after controlling for the home and away teams, week, and season, the adjusted difference is -2.1 points with a 95% interval from -5.7 to +1.5 and a Holm-adjusted p-value of 0.318.
If you have been benching or starting skill players based on whether a game is indoors, the raw numbers back you up: dome and closed-roof NFL games through 2025 averaged 48.3 combined points versus 44.8 for outdoor or open-roof games. But once the study accounts for which home and away teams are actually playing, that 3.5-point edge flips to an adjusted difference of -2.1 points with a 95% interval from -5.7 to +1.5 and a Holm-adjusted p-value of 0.318. In other words, the dome scoring bump you see in box scores is largely a product of team composition, not the roof itself.
The sample covers 640 dome or closed-roof games and 1,487 outdoor or open-roof games from NFL regular seasons through 2025, all drawn from nflverse schedules and play-by-play data. The comparison controls for week, season, and the specific home and away teams in each game, so the adjusted estimates answer a sharper question: do indoor games still look different when the same teams are effectively compared against themselves across venue types?
For scoring, the answer is no. The unadjusted 3.5-point gap in combined points flips to an adjusted -2.1 points, and the 95% interval comfortably spans zero. The raw dome advantage is real in the data, but it does not survive once you stop letting dome-heavy offenses inflate the comparison. One caveat on uncertainty: the game-level bootstrap interval for combined points (+2.2 to +4.8 points) stays positive and excludes zero, while the team-adjusted HC3 interval spans it. The headline conclusion rests on the registered adjusted estimate, but the two uncertainty methods disagree on the raw comparison, which is exactly where team composition does the most work.
| Outcome | Dome or closed roof | Outdoor or open roof | Adjusted change | 95% interval | Holm p |
|---|---|---|---|---|---|
| Combined points | 48.3 | 44.8 | -2.1 points | -5.7 points to +1.5 points | 0.318 |
| Neutral early-down dropback rate | 53.9% | 53.7% | +1.9 pts | -0.1 pts to +3.9 pts | 0.178 |
| Pass EPA per dropback | 0.038 | 0.037 | -0.050 | -0.099 to -0.001 | 0.178 |
| Deep-target rate | 10.9% | 10.8% | +0.8 pts | -0.3 pts to +1.8 pts | 0.318 |
The passing-game outcomes tell the same story. Neutral early-down dropback rate, meaning how often teams pass on early downs when the game script is still balanced, averaged 53.9% indoors versus 53.7% outdoors, with an adjusted change of +1.9 percentage points and a 95% interval from -0.1 to +3.9 percentage points (Holm-adjusted p = 0.178). Deep-target rate, the share of passes thrown 20 or more yards downfield, averaged 10.9% versus 10.8%, with an adjusted change of +0.8 percentage points and an interval from -0.3 to +1.8 percentage points (Holm-adjusted p = 0.318). Neither clears the bar after multiplicity adjustment.
One outcome moved after adjustment, but in the wrong direction for dome optimists. Pass EPA per dropback, a per-play measure of expected points added on passing plays, averaged 0.038 indoors versus 0.037 outdoors, yet the adjusted difference was -0.050 with a 95% interval from -0.099 to -0.001 and a Holm-adjusted p-value of 0.178. The HC3 interval sits entirely below zero, but two pieces of evidence argue against reading this as a dome penalty: the Holm-adjusted p-value does not survive the family-wide correction, and the game-level bootstrap interval for this outcome (-0.019 to +0.022, bootstrap p = 0.92) straddles zero entirely. Treat this as noise, not a signal.
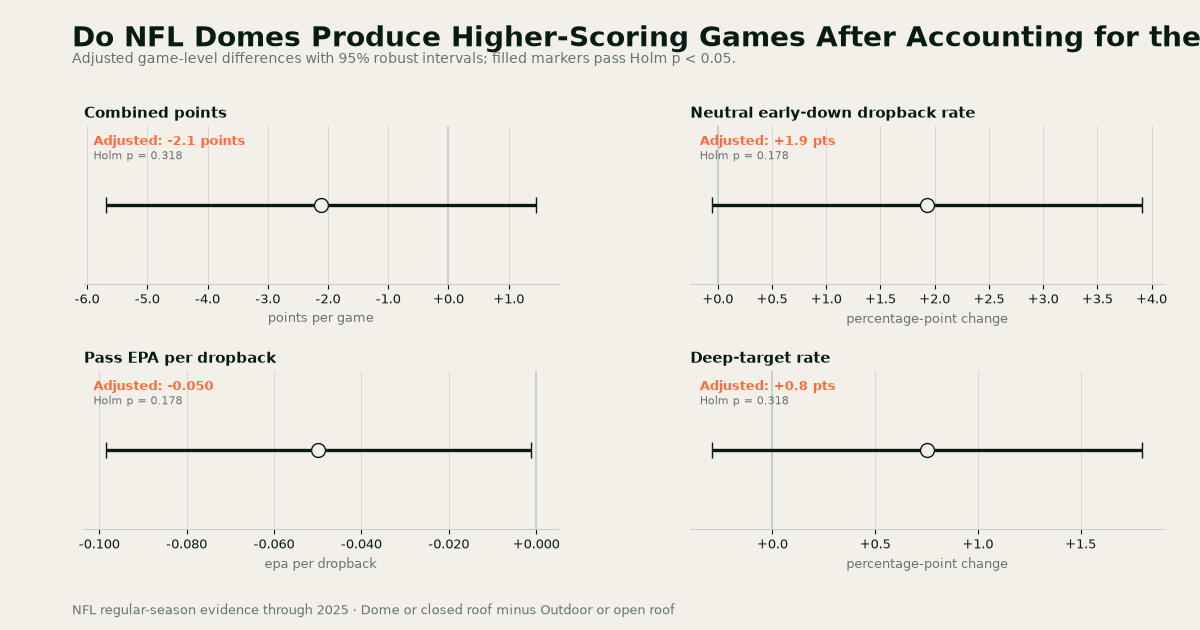
The practical takeaway for fantasy managers is restraint. The dome bump you notice in weekly box scores is mostly a who-is-playing effect, not a where-they-are-playing effect. These are retrospective associations from observed game conditions, not causal claims, and they say nothing about whether a pregame weather or roof forecast would improve your projections. Before auto-starting a receiver because his game is indoors, check who is under center and who is calling the defense; the roster is doing far more work than the roof.
METHODS · SOURCES · REVIEW TRAILOpen the Research File+
QUESTION
Do dome and closed-roof games retain higher scoring, passing efficiency, and deep-target rates after the participating teams are accounted for?
METHOD
- Registered contrast: fixed or retractable roof recorded closed, or dome, versus outdoor or open roof, using nflverse recorded roof fields through the 2025 season.
- Sample: 640 condition games and 1,487 control games across 2,127 comparable regular-season games from 2018 through 2025; all registered sample gates passed.
- Controls: week and season fixed effects plus home-team and away-team fixed effects, so adjusted estimates compare games holding team composition constant.
- Outcomes: combined points, neutral early-down dropback rate, pass EPA per dropback, and deep-target rate, each with per-outcome denominator reconciliation (no undefined games in this contrast).
- Uncertainty: 4,000 game-level bootstrap draws per outcome plus HC3 robust OLS intervals; Holm correction applied across the preregistered outcome family. Bootstrap and HC3 intervals are reported side by side where they disagree.
- Reproducibility: each bootstrap seeded from SHA-256 of the study:outcome label; two complete executions produced identical result hashes.
- NOAA weather observations were not used; the roof state comes from football and recorded venue fields.
LIMITS
- These are retrospective associations from observed postgame conditions, not causal effects of playing indoors.
- The estimates cannot be used as a pregame forecast input; observed conditions are not projections.
- For combined points, the game-level bootstrap interval (+2.2 to +4.8) disagrees with the team-adjusted HC3 interval (-5.7 to +1.5); the registered conclusion rests on the adjusted estimate.
- For pass EPA per dropback, the HC3 interval sits below zero but the Holm-adjusted p-value (0.178) does not survive the family-wide correction and the bootstrap interval (-0.019 to +0.022) straddles zero.
- The study covers NFL regular-season games through 2025 and uses the recorded roof state, not weather observations.
SOURCES
- nflverse NFL schedules and play-by-playCC BY 4.0
SHA-256 abd8ad1e4ddbf6cc1df651c0a038f809427de656e69fd488f1c4bd252a8c59ae
DOWNLOADABLE DATA
REVIEW TRAIL
Statistics and figures come from deterministic code. The Research File contains the registration, provenance, specialist reviews, and gate decision.