If you are deciding between two kickers and one is playing in a genuinely windy game, the wind matters: combined kicker fantasy scoring across both teams drops from 16.0 points per game in below-10-mph conditions to 14.2 at 12+ mph and 13.9 at 15+ mph, and those gaps survive statistical correction. The cleanest breakpoint in the data is 12 mph — that is where both attempts and accuracy separate clearly from calm games.
The study compares NFL regular-season games from 2018 through the 2024 season across three locked wind thresholds — 10, 12, and 15+ mph — against the same control group of games played in below-10-mph wind. The registered 15+ mph contrast contains 101 condition games and 807 control games. All scoring figures are combined kicker fantasy points per game across both teams, so they describe the scoring environment, not any individual kicker.
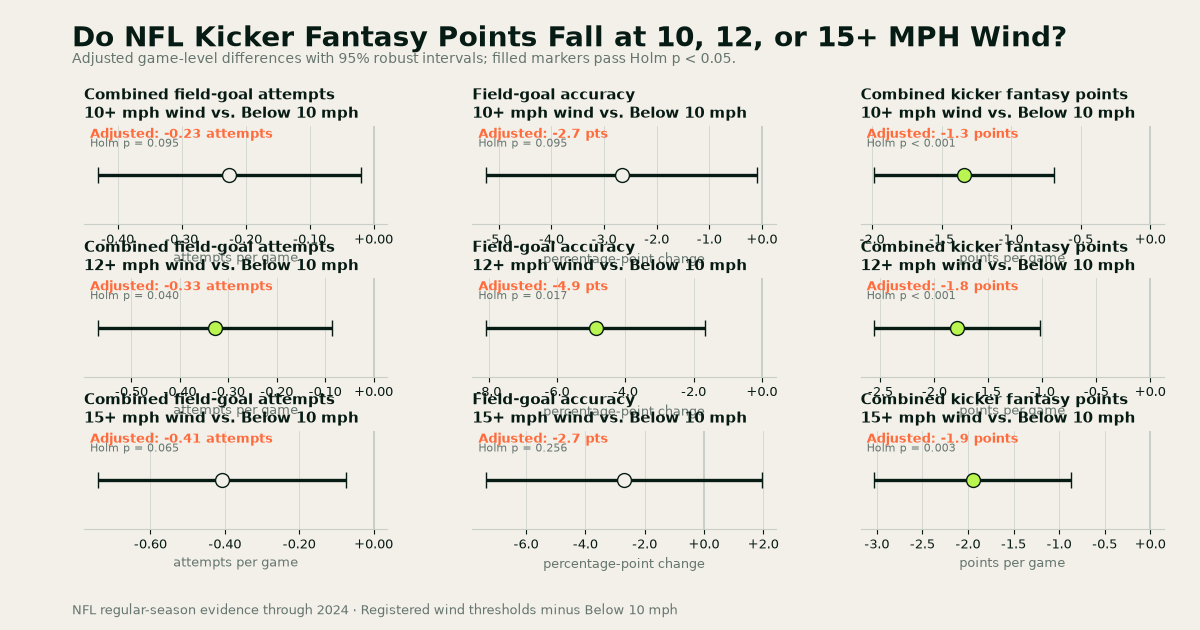
The headline result is the scoring decline, and it is consistent at every threshold. Combined kicker fantasy points averaged 14.7 in 10+ mph wind games versus 16.0 in calm games, an adjusted change of -1.3 points with a 95% interval from -2.0 to -0.7 and a Holm-adjusted p-value of <0.001. At 12+ mph the adjusted change is -1.8 points (14.2 vs 16.0; 95% interval -2.6 to -1.0; Holm p <0.001). At 15+ mph it is -1.9 points (13.9 vs 16.0; 95% interval -3.0 to -0.9; Holm p 0.003). Holm-adjusted p-values are the study's strictest test — they correct for the fact that nine threshold-outcome comparisons were made at once — so these scoring results hold up under the most conservative reading.
Where does the scoring go? Two places, and the threshold ladder tells the story. Field-goal attempts fall gradually as wind rises: -0.23 attempts at 10+ mph (3.65 vs 3.87; 95% interval -0.43 to -0.02; Holm p 0.095), -0.33 at 12+ mph (3.54 vs 3.87; 95% interval -0.57 to -0.09; Holm p 0.040), and -0.41 at 15+ mph (3.44 vs 3.87; 95% interval -0.74 to -0.07; Holm p 0.065). Accuracy, meanwhile, does not decline in a straight line. It drops hardest at 12+ mph — 79.6% versus 84.7% in calm games, an adjusted change of -4.9 percentage points (95% interval -8.1 to -1.7; Holm p 0.017) — but at 15+ mph the estimate is -2.7 points with an interval that spans zero (-7.3 to +2.0; Holm p 0.256). That 15 mph accuracy result is a null finding: with only 100 games where accuracy is defined, the data cannot distinguish a real drop from no drop at all.
Put together, the deterioration is gradual in attempts but the clearest usable breakpoint for fantasy purposes is 12 mph. That is the threshold where both volume and accuracy separate from calm games after multiplicity correction, and where the scoring gap is largest relative to its uncertainty. The 10 mph threshold shows a real scoring drop, but its attempts and accuracy changes sit just above the corrected significance line (Holm p 0.095 for both), so treat 10 mph as suggestive and 12 mph as the level where the evidence firms up.
| Outcome | Registered wind thresholds | Below 10 mph | Adjusted change | 95% interval | Holm p |
|---|---|---|---|---|---|
| Combined field-goal attempts — 10+ mph wind | 3.65 | 3.87 | -0.23 attempts | -0.43 attempts to -0.02 attempts | 0.095 |
| Field-goal accuracy — 10+ mph wind | 82.1% | 84.7% | -2.7 pts | -5.2 pts to -0.1 pts | 0.095 |
| Combined kicker fantasy points — 10+ mph wind | 14.7 | 16.0 | -1.3 points | -2.0 points to -0.7 points | <0.001 |
| Combined field-goal attempts — 12+ mph wind | 3.54 | 3.87 | -0.33 attempts | -0.57 attempts to -0.09 attempts | 0.040 |
| Field-goal accuracy — 12+ mph wind | 79.6% | 84.7% | -4.9 pts | -8.1 pts to -1.7 pts | 0.017 |
| Combined kicker fantasy points — 12+ mph wind | 14.2 | 16.0 | -1.8 points | -2.6 points to -1.0 points | <0.001 |
| Combined field-goal attempts — 15+ mph wind | 3.44 | 3.87 | -0.41 attempts | -0.74 attempts to -0.07 attempts | 0.065 |
| Field-goal accuracy — 15+ mph wind | 82.8% | 84.7% | -2.7 pts | -7.3 pts to +2.0 pts | 0.256 |
| Combined kicker fantasy points — 15+ mph wind | 13.9 | 16.0 | -1.9 points | -3.0 points to -0.9 points | 0.003 |
Two boundaries on what this means. First, these are retrospective associations from observed game-window conditions — they do not establish that wind causes the decline, and they do not prove that a pregame wind forecast improves fantasy projections. Windy games may differ from calm games in other ways the controls (week and season fixed effects, air temperature, and average field-goal distance for the accuracy model) do not capture. Second, the weather data run through the 2024 season, so the estimates stop there. What the study does support is that, historically, kickers in games played at 12 mph wind or above have scored materially less than kickers in calm games — a fact worth weighing when a genuinely windy matchup is on your radar.
METHODS · SOURCES · REVIEW TRAILOpen the Research File+
QUESTION
At which registered wind threshold do NFL field-goal attempts, accuracy, and combined kicker fantasy scoring separate from games below 10 mph?
METHOD
- Registered contrast: observed 15+ mph wind vs below 10 mph, with locked 10, 12, and 15 mph threshold ladder against the same below-10-mph control group.
- Population: NFL regular-season games, 2018 through the 2024 season (latest season with usable observed weather data).
- Outcomes: combined field-goal attempts per game, field-goal accuracy (share, adjusted for average field-goal distance), and combined kicker fantasy points per game across both teams.
- Controls: week and season fixed effects plus air temperature; average field-goal distance added only to the accuracy model. Continuous wind is not adjusted for because wind defines the treatment groups.
- Uncertainty: 4,000 game-level bootstrap draws and HC3 robust OLS 95% intervals; Holm correction applied across the full preregistered family of nine threshold-outcome comparisons.
- Denominators: field-goal accuracy is undefined when neither team attempts a field goal (13, 13, and 12 such games at the 10, 12, and 15 mph thresholds respectively); all other outcomes cover all comparable games.
- Sample gates: minimum 750 comparable games and 100 condition games; the 15+ mph contrast cleared with 101 condition and 807 control games (908 comparable).
- Reproducibility: bootstrap seeds derived from SHA-256 of study:outcome labels; two complete executions produced identical result hashes. Station agreement check passed (paired-station wind readings within 2.5 m/s mean absolute difference).
LIMITS
- These are observed, retrospective associations; no causal claim is made and observed postgame conditions are not eligible as pregame projection inputs.
- The 15+ mph accuracy estimate is a null result (95% interval -7.3 to +2.0 points; Holm p 0.256) and should not be read as evidence of a further accuracy drop.
- The 10+ mph attempts and accuracy changes do not survive Holm correction (p 0.095 each); only the scoring decline is conclusive at that threshold.
- Weather data run through 2024; the study does not cover the 2025 season.
- Combined kicker fantasy points pool both teams' kickers per game and do not describe any individual kicker.
SOURCES
- nflverse NFL schedules and play-by-playCC BY 4.0
SHA-256 abd8ad1e4ddbf6cc1df651c0a038f809427de656e69fd488f1c4bd252a8c59ae - NOAA Global Hourly stadium observationsUS Government work; NOAA data are generally public domain
SHA-256 066a8418d7341118c7d34028997dbe39a77e2725349cf89883c5f576bf248658 - Wikidata stadium coordinatesCC0 1.0
SHA-256 ac17d4b5ea72b31f0c127cf570a79f961370090bb090864710fd34c17312afd4
REVIEW TRAIL
Statistics and figures come from deterministic code. The Research File contains the registration, provenance, specialist reviews, and gate decision.