Do not rewrite your wide receiver rankings after Week 1. Once you have two games of target-share data, give the current role more weight than last season's role while still accounting for preseason expectations and team context.
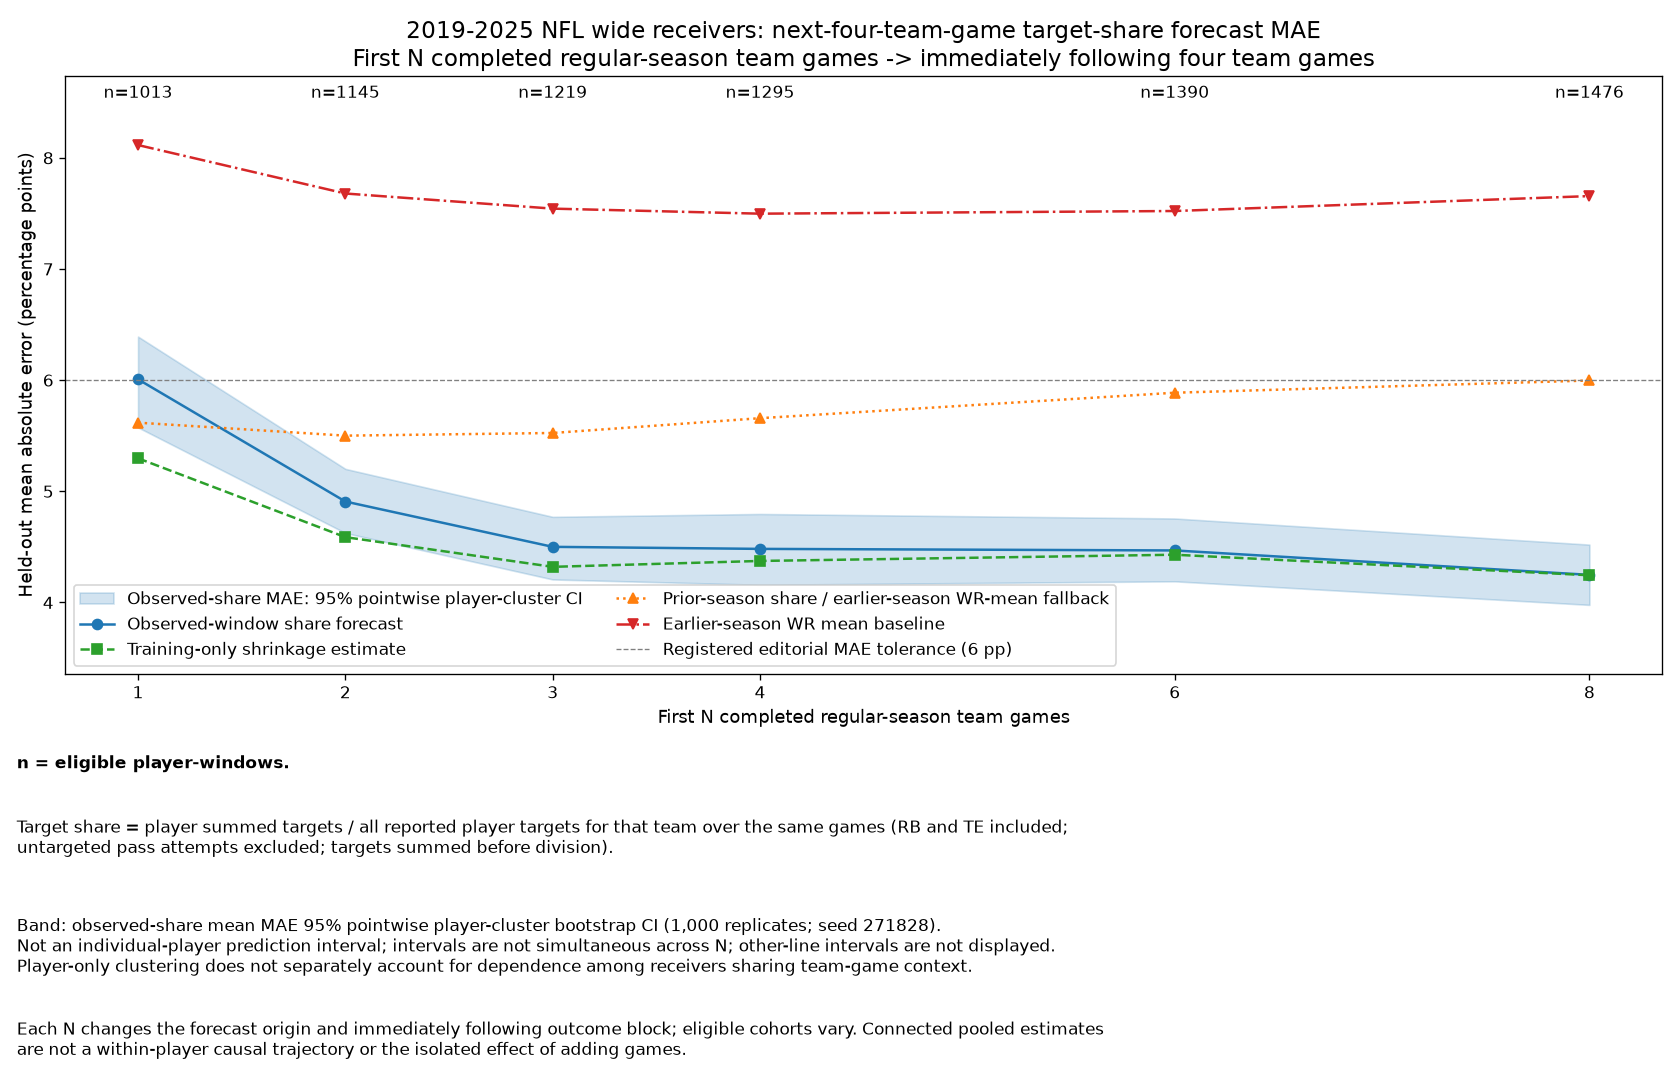
Every September brings the same fantasy question: should a surprising target share change how you value a wide receiver, or was it one strange game? We tested how well target share after 1, 2, 3, 4, 6, and 8 completed team games predicted each receiver's share over his next four team games. The first useful checkpoint arrived after two games, not after a full month.
One game was too early. Two games changed the forecast.
After one game, current target share missed the next four games by an average of 6.01 percentage points. The historical baseline was better at 5.62. After two games, the order flipped: current target share improved to a 4.91-point average miss versus 5.50 for the baseline. The 0.59-point edge had a 95% interval of 0.27 to 0.91, so the improvement was not just a rounding accident.
Current target share after 1 game
Worse than the 5.62-point historical baseline.
Current target share after 2 games
Better than the 5.50-point historical baseline.
Two-game edge over history
95% interval: 0.27 to 0.91 points.
Two-game blended estimate
The best point estimate, although its edge over raw share was not interval-tested.
How to use this during the fantasy season
Use Week 1 target share as a reason to investigate, not as a reason to overhaul your rankings. After Week 2, a persistent change deserves real weight in waiver and trade evaluation because the current role forecast better than the historical baseline in this test. Keep blending the new evidence with routes, injuries, team pass volume, talent, and preseason expectations. The blended target-share estimate had the lowest point estimate at every window we tested, which argues against treating any raw two-game number as the whole forecast.
This study forecasts target share, not fantasy points. It cannot see route quality, injuries, touchdowns, or whether a player will turn his opportunities into production. Two games are enough to update your view of a receiver's role, not enough to make an automatic start, sit, buy, or sell decision.
This finding is now a proposed signal, not part of the official rankings. Its challenger will heavily shrink one-game target share, give current usage more weight from Game 2 onward, and test the result against the active model on held-out weekly fantasy points. It can reach the official rankings only by passing the model-promotion gates; until then, it stays isolated for experimental comparison.
| Games observed | Wide receivers | Player-windows | Current share error (pp) | Current share 95% interval | Blended share error (pp) | Historical baseline error (pp) | Historical baseline 95% interval | Earlier-season average error (pp) | Baseline fallback windows | Current share edge (pp) | Edge 95% interval |
|---|---|---|---|---|---|---|---|---|---|---|---|
| 1 | 369 | 1013 | 6.01 | 5.57 to 6.39 | 5.3 | 5.62 | 5.30 to 5.94 | 8.12 | 171 | -0.39 | -0.76 to -0.01 |
| 2 | 416 | 1145 | 4.91 | 4.63 to 5.20 | 4.59 | 5.5 | 5.19 to 5.84 | 7.68 | 206 | 0.59 | 0.27 to 0.91 |
| 3 | 430 | 1219 | 4.5 | 4.21 to 4.77 | 4.32 | 5.52 | 5.23 to 5.82 | 7.54 | 224 | 1.02 | 0.73 to 1.31 |
| 4 | 447 | 1295 | 4.48 | 4.16 to 4.80 | 4.37 | 5.66 | 5.35 to 5.95 | 7.5 | 254 | 1.18 | 0.87 to 1.46 |
| 6 | 468 | 1390 | 4.47 | 4.19 to 4.76 | 4.43 | 5.89 | 5.60 to 6.17 | 7.52 | 296 | 1.42 | 1.16 to 1.69 |
| 8 | 482 | 1476 | 4.25 | 3.98 to 4.52 | 4.24 | 6 | 5.72 to 6.30 | 7.66 | 328 | 1.75 | 1.49 to 2.02 |
The practical rule is simple: let Week 1 create questions, then let Week 2 start changing your answers. A receiver's current target share became more useful than the historical baseline after two games and stayed ahead at every later checkpoint we tested. Treat that as permission to update your estimate of his role, while remembering that role is only one input into a fantasy decision.
METHODS · SOURCES · REVIEW TRAILOpen the Research File+
QUESTION
How many completed team games are needed for a wide receiver's observed target share to predict his share over the next four team games reliably?
METHOD
- Evaluated NFL wide receivers in regular-season weekly statistics using rolling 2019-2025 forecast seasons. Information from 2018 was available only for earlier-season training and baselines.
- Built strictly disjoint observation windows of 1, 2, 3, 4, 6, and 8 completed team games, with every forecast scored on the immediately following four team games.
- Defined target share as a player's summed targets divided by all reported player targets for his team over the same games. RB and TE targets were included, untargeted pass attempts were excluded, and targets were summed before division.
- Compared raw observed-window share, training-only shrinkage, prior-season share with an earlier-season WR mean fallback, and a separate earlier-season WR mean baseline.
- Measured held-out mean absolute error in percentage points and paired comparator-minus-raw improvement. Uncertainty used 1,000 player-cluster bootstrap replicates.
LIMITS
- Eligibility required a recorded WR row within each observation window, so the population does not represent every rostered or preseason-relevant receiver.
- Forecast origins, following four-game outcome blocks, and eligible cohorts differ across window lengths. The curve is not a within-player causal trajectory or an isolated estimate of adding games.
- Bootstrap intervals describe uncertainty in average error or paired average improvement. They are not individual-player prediction intervals or simultaneous intervals across all windows.
- Player clustering does not separately account for dependence among receivers sharing team-game context.
- Intervals were not supplied for head-to-head differences between raw-share and shrinkage forecasts.
- Target-share forecast error is not fantasy-point forecast error and cannot support player-specific start, sit, trade, or waiver commands.
- Results describe historical 2019-2025 reliability and do not validate recommendations for 2026 players. The editorial error thresholds are not universal statistical standards.
SOURCES
- nflverse 2018 weekly player statisticsCC BY 4.0Data made available by nflverse contributors.Downloaded fresh for this run; the run manifest records its SHA-256.Underlying NFL data remain subject to their owners' terms.
SHA-256 c53021bcfc9f89d30edd6f1fe145a1d7d6ce469efeec75974fe9f0adac568642 - nflverse 2019 weekly player statisticsCC BY 4.0Data made available by nflverse contributors.Downloaded fresh for this run; the run manifest records its SHA-256.Underlying NFL data remain subject to their owners' terms.
SHA-256 a05558126b1209b80fe11a8f18938cb35816370bf9990975a87de49e9eed7376 - nflverse 2020 weekly player statisticsCC BY 4.0Data made available by nflverse contributors.Downloaded fresh for this run; the run manifest records its SHA-256.Underlying NFL data remain subject to their owners' terms.
SHA-256 05b992676faccc8940efbf6242cb76358069372d31d7c2e02c1a4acdcd3cbe18 - nflverse 2021 weekly player statisticsCC BY 4.0Data made available by nflverse contributors.Downloaded fresh for this run; the run manifest records its SHA-256.Underlying NFL data remain subject to their owners' terms.
SHA-256 41915fb49238902ad1f129ebf0405b11a1e710454ae0fe8f7b3e4f9145875f48 - nflverse 2022 weekly player statisticsCC BY 4.0Data made available by nflverse contributors.Downloaded fresh for this run; the run manifest records its SHA-256.Underlying NFL data remain subject to their owners' terms.
SHA-256 ad426c3fe5bf1cc30c3f137fdfe96d054e19d400879ee4413129da49fa7b54be - nflverse 2023 weekly player statisticsCC BY 4.0Data made available by nflverse contributors.Downloaded fresh for this run; the run manifest records its SHA-256.Underlying NFL data remain subject to their owners' terms.
SHA-256 f19cb71a5de0dce7fd09376026237c9ee9d5a93fe13815a2ea3ec2d37204cb17 - nflverse 2024 weekly player statisticsCC BY 4.0Data made available by nflverse contributors.Downloaded fresh for this run; the run manifest records its SHA-256.Underlying NFL data remain subject to their owners' terms.
SHA-256 3ddc45a84f759aa348ce465ae001752c530575455717657cdfe1f8abfcdb4759 - nflverse 2025 weekly player statisticsCC BY 4.0Data made available by nflverse contributors.Downloaded fresh for this run; the run manifest records its SHA-256.Underlying NFL data remain subject to their owners' terms.
SHA-256 e5e0615b3d96a3eaebfaee91e55afb4a4e7fe0caf057454177bcd7d6ad4bcfc2 - nflverse NFL schedulesCC BY 4.0Data made available by nflverse contributors.Downloaded fresh for this run; the run manifest records its SHA-256.Underlying NFL data remain subject to their owners' terms.
SHA-256 c9d3896dafb1ca89b0bd9196d7e5948b16d56cb258a145bd71ef771069c3a605
DOWNLOADABLE DATA
REVIEW TRAIL
Statistics and figures come from deterministic code. The Research File contains the registration, provenance, specialist reviews, and gate decision.