Waiting until 6 hours before kickoff gets you a measurably better temperature and wind forecast than the day-before call. The rain call improves slightly too, but that improvement is not statistically distinguishable from no change.
If you hold lineup decisions until the morning of kickoff, the evidence says the extra wait pays off on the two weather inputs that most affect passing and kicking environments: temperature and wind.
We scored 2,205 cutoff-safe archived NOAA HRRR forecasts for NFL regular-season stadium-games against matched NOAA game-window observations, drawn from 2,516 registered requests (87.6% coverage, every stadium represented). Every forecast was proven available in the archive before its registered 6-hour or 24-hour pregame cutoff, so none of these numbers could have peeked at postgame information. The scorecard currently runs through the 2024 season; the 2025 season is not yet included in this release.
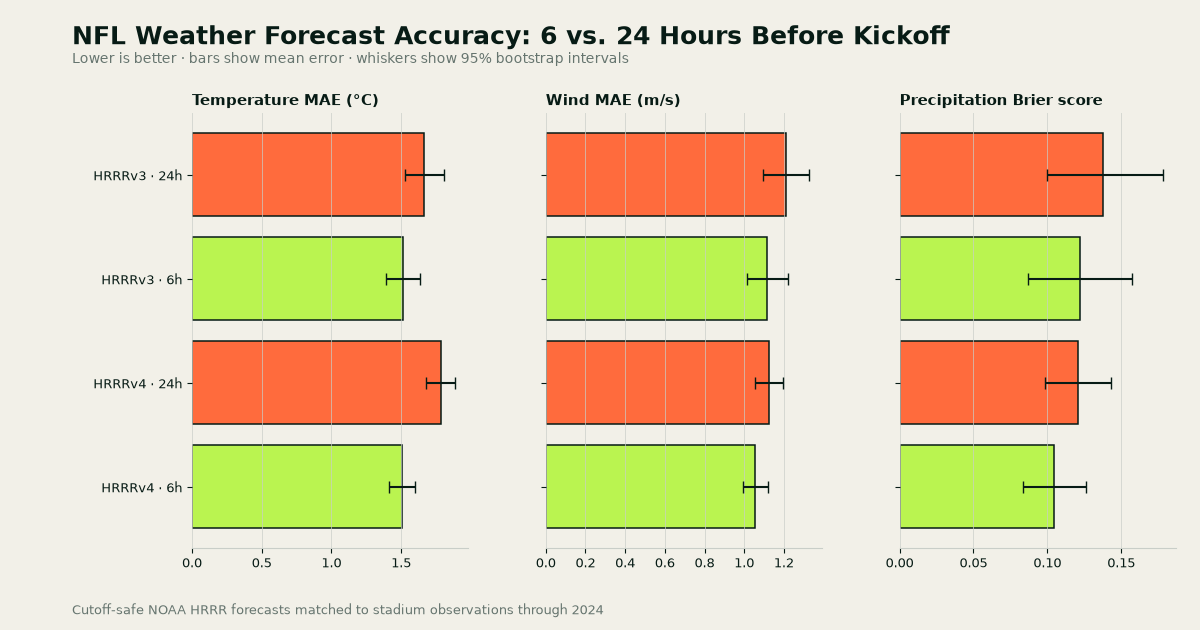
The core test is paired: for the same stadium-games, we compared each 6-hour forecast against its 24-hour counterpart, reported separately for the two HRRR model eras and never pooled into a single headline number. Negative differences mean the 6-hour forecast was more accurate.
| Model | Cutoff | Forecasts | Temperature | Wind | Rain | Missing |
|---|---|---|---|---|---|---|
| HRRRv3 | 6 hours | 352 | 1.51 °C | 1.12 m/s | 0.122 | 0.0% |
| HRRRv3 | 24 hours | 326 | 1.66 °C | 1.21 m/s | 0.138 | 0.0% |
| HRRRv4 | 6 hours | 764 | 1.50 °C | 1.06 m/s | 0.105 | 0.0% |
| HRRRv4 | 24 hours | 763 | 1.78 °C | 1.13 m/s | 0.121 | 0.0% |
Where the 6-hour forecast clearly wins
Temperature is the cleanest result. In the HRRRv3 era, the paired 6-hour-minus-24-hour difference in mean absolute error was -0.146 °C (95% bootstrap interval -0.253 to -0.038). In the HRRRv4 era it was -0.281 °C (-0.350 to -0.214). Both intervals sit entirely below zero, so the shorter lead time is genuinely more accurate, not just lucky. Wind shows the same pattern: -0.084 m/s (-0.144 to -0.024) for HRRRv3 and -0.069 m/s (-0.115 to -0.024) for HRRRv4.
Those are modest margins in absolute terms, but wind is the input most likely to flip a deep-ball or kicking decision, and the direction is consistent across both model eras and both metrics.
Where the edge is not yet established
Precipitation tells a softer story. The paired Brier-score differences favored the 6-hour forecast in both eras — -0.009 for HRRRv3 and -0.016 for HRRRv4 — but both 95% bootstrap intervals cross zero (-0.041 to +0.022 and -0.038 to +0.005). The point estimates lean toward the 6-hour forecast; the data does not yet rule out no difference. If your call hinges on rain rather than wind, waiting is a reasonable habit, not a proven edge.
| Model | Paired games | Temperature | Wind | Rain |
|---|---|---|---|---|
| HRRRv3 | 316 | -0.15 °C | -0.08 m/s | -0.009 |
| HRRRv4 | 739 | -0.28 °C | -0.07 m/s | -0.016 |
What this means for a fantasy decision
This is a population-level result about forecast accuracy, not a player-specific instruction. The practical takeaway: weather-adjusted lineup arguments built on a day-old forecast are working with measurably worse temperature and wind information than the same forecast made 6 hours out. If you are weighing a wind-affected kicker or a deep-shot receiver in a late window, the morning-of forecast is the one worth trusting on those two inputs. The rain forecast is roughly a coin-flip between the two lead times on current evidence.
The scorecard covers the 2018 through 2024 NFL regular seasons. The 2025 season is not yet in this release, so treat these as the latest completed-season-of-record numbers available here, not a claim about the current campaign.
The verdict: for NFL regular-season stadium-games from 2018 through 2024, the 6-hour HRRR forecast is the more accurate temperature and wind input for your lineup calls, beating the 24-hour forecast by 0.15–0.28 °C and 0.07–0.08 m/s in paired same-game comparisons across both model eras. The rain edge points the same way but remains inside its uncertainty band, so treat precipitation as unproven either way. Wait for the morning-of forecast when wind or temperature drives your decision, and check the Research File for methods, provenance, and limitations.
METHODS · SOURCES · REVIEW TRAILOpen the Research File+
QUESTION
At 6-hour and 24-hour cutoffs, how accurately do archived NOAA HRRR forecasts predict NFL stadium temperature, wind, and precipitation?
METHOD
- Archived NOAA HRRR forecasts at 6-hour and 24-hour pregame cutoffs, matched to NOAA Global Hourly game-window observations at NFL stadium grid points; nflverse schedules and play-by-play define the game windows.
- Paired 6-hour-minus-24-hour differences computed within each HRRR version for the same stadium-games; negative differences favor the 6-hour forecast.
- Uncertainty from 4,000 deterministic nonparametric bootstrap draws per estimate; deterministic rerun reproduced the same result hash.
- Full methods, provenance, review traces, and limitations are in the Research File.
LIMITS
- Precipitation differences favor the 6-hour forecast on point estimate but their 95% intervals cross zero in both model eras.
- Coverage is 87.6% of registered archive requests; 311 requests could not be resolved and are excluded.
- The release runs through the 2024 season; 2025 games are not yet scored.
- Results describe forecast accuracy for the stadium-game population, not any individual player's performance.
SOURCES
- NOAA Global Hourly stadium observationsUS Government work; NOAA data are generally public domain
SHA-256 4cfe1722a80c85e4c540dae29ba46bc17bab838d5807477f3b2c9d91c5f5764d - NOAA High-Resolution Rapid Refresh forecast archiveUS Government work; NOAA data are generally public domain
SHA-256 90ca39ca9a7a5affd046611e93ddeb1e99b7e43663664addd1cc93109db8e821 - nflverse NFL schedules and play-by-playCC BY 4.0
SHA-256 0ebea0b2a33b20ab95c61201e89b570ead4dbc2fdf6ae34c34e4c960e678df94
DOWNLOADABLE DATA
REVIEW TRAIL
Statistics and figures come from deterministic code. The Research File contains the registration, provenance, specialist reviews, and gate decision.