By the end of Year 2, 54.5% of Round 1 wide receivers had produced a top-36 PPR season, versus 31.3% in Round 2, 17.2% in Round 3, and 4.6% on Day 3.
Some rookie wide receivers need time. The useful question is whether patience changes the base rate enough to justify holding every slow starter. It does not.
Round 1
+16.4 points after the rookie season
Round 2
+13.4 points after the rookie season
Day 3
+3.1 points after the rookie season
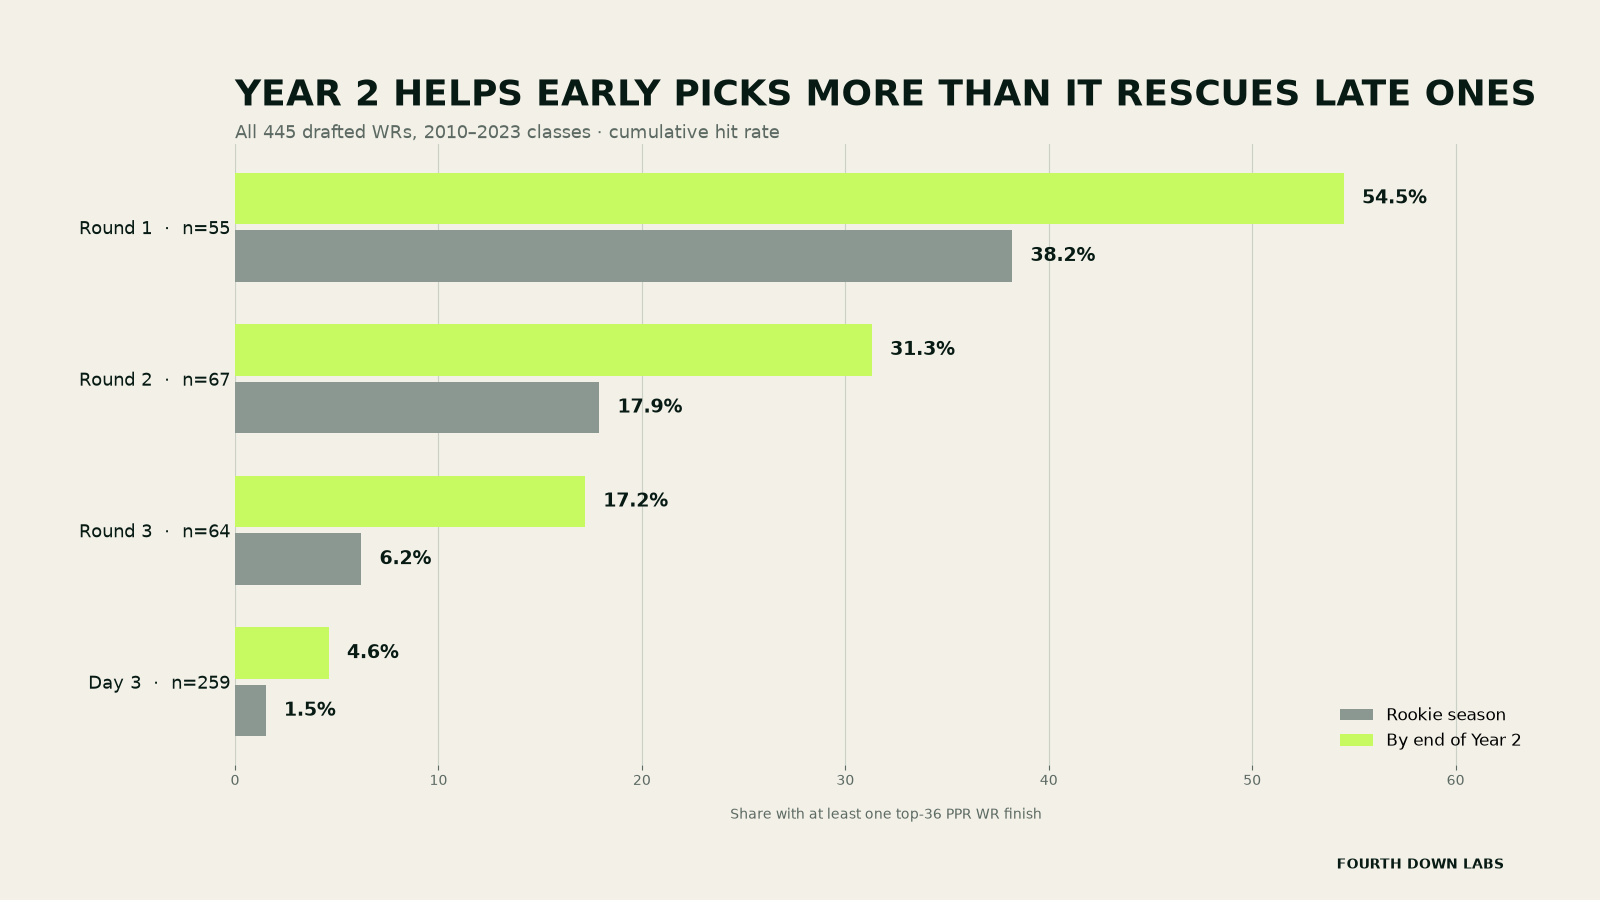
The second season added nine new hits in Round 1, nine in Round 2, seven in Round 3, and eight across all 259 Day 3 receivers. Patience created more success everywhere, but it did not flatten the draft-capital curve.
Patience helps early picks more than it rescues late ones
| Draft tier | Drafted WRs | Rookie rate | By Year 2 | Year 2 gain |
|---|---|---|---|---|
| Round 1 | 55 | 38.2% | 54.5% | +16.4 pts |
| Round 2 | 67 | 17.9% | 31.3% | +13.4 pts |
| Round 3 | 64 | 6.2% | 17.2% | +10.9 pts |
| Day 3 | 259 | 1.5% | 4.6% | +3.1 pts |
The correct lesson is not to cut every quiet rookie. It is to demand more evidence as draft capital falls. A first-round receiver gets meaningful benefit of the doubt. A Day 3 receiver needs a real role signal because the historical prior barely moves by Year 2.
Be patient with investment. Be skeptical of hope without opportunity.
METHODS · SOURCES · REVIEW TRAILOpen the Research File+
QUESTION
How often had NFL-drafted wide receivers produced at least one top-36 full-PPR season by the end of Year 2, conditional on draft capital?
METHOD
- Derived from the accepted FDL-002 cohort of 445 drafted wide receivers from 2010–2023.
- The outcome is cumulative through Year 2: a top-36 full-PPR finish in either of the first two seasons.
- The same complete denominator is used for rookie-season and Year 2 rates.
- Round 4 through Round 7 are combined as Day 3 for the primary comparison.
LIMITS
- The result describes historical base rates; it is not a sell rule for an individual player.
- The analysis does not condition on rookie-year routes, targets, injuries, or team changes.
- Top-36 PPR is a fantasy-utility threshold rather than a universal measure of NFL quality.
- Undrafted free agents are outside the target population.
SOURCES
- nflverse draft picksCC BY 4.0 (nflverse compilation; underlying NFL data retain owner terms)
SHA-256 91f1ead0d531aec7e219e3f19756b3084d8ef6d8dbf37c8b4ec147dd3985c215 - nflverse player statsCC BY 4.0 (nflverse compilation; underlying NFL data retain owner terms)
SHA-256 45b06f7b7c88cf8338b239653eeb8063c0d4e4cd814de6f13d55e9ab88101de7 - nflverse 2025 regular-season player statisticsCC BY 4.0 (nflverse compilation; underlying NFL data retain owner terms)
SHA-256 aaa8559478dd8d58569c93e278239e70e9411e79ee649c99d8d506030cd42b12
DOWNLOADABLE DATA
REVIEW TRAIL
This companion brief is derived deterministically from the accepted FDL-002 cohort and links to the same reviewed evidence bundle.