NFL Draft capital is a strong prior: 65.5% of Round 1 receivers reached a top-36 fantasy season by Year 3, compared with 6.2% on Day 3.
Rookie wide receivers are where fantasy optimism outruns the denominator. We kept every drafted receiver from 2010–2023, including the players who never recorded an NFL fantasy point.
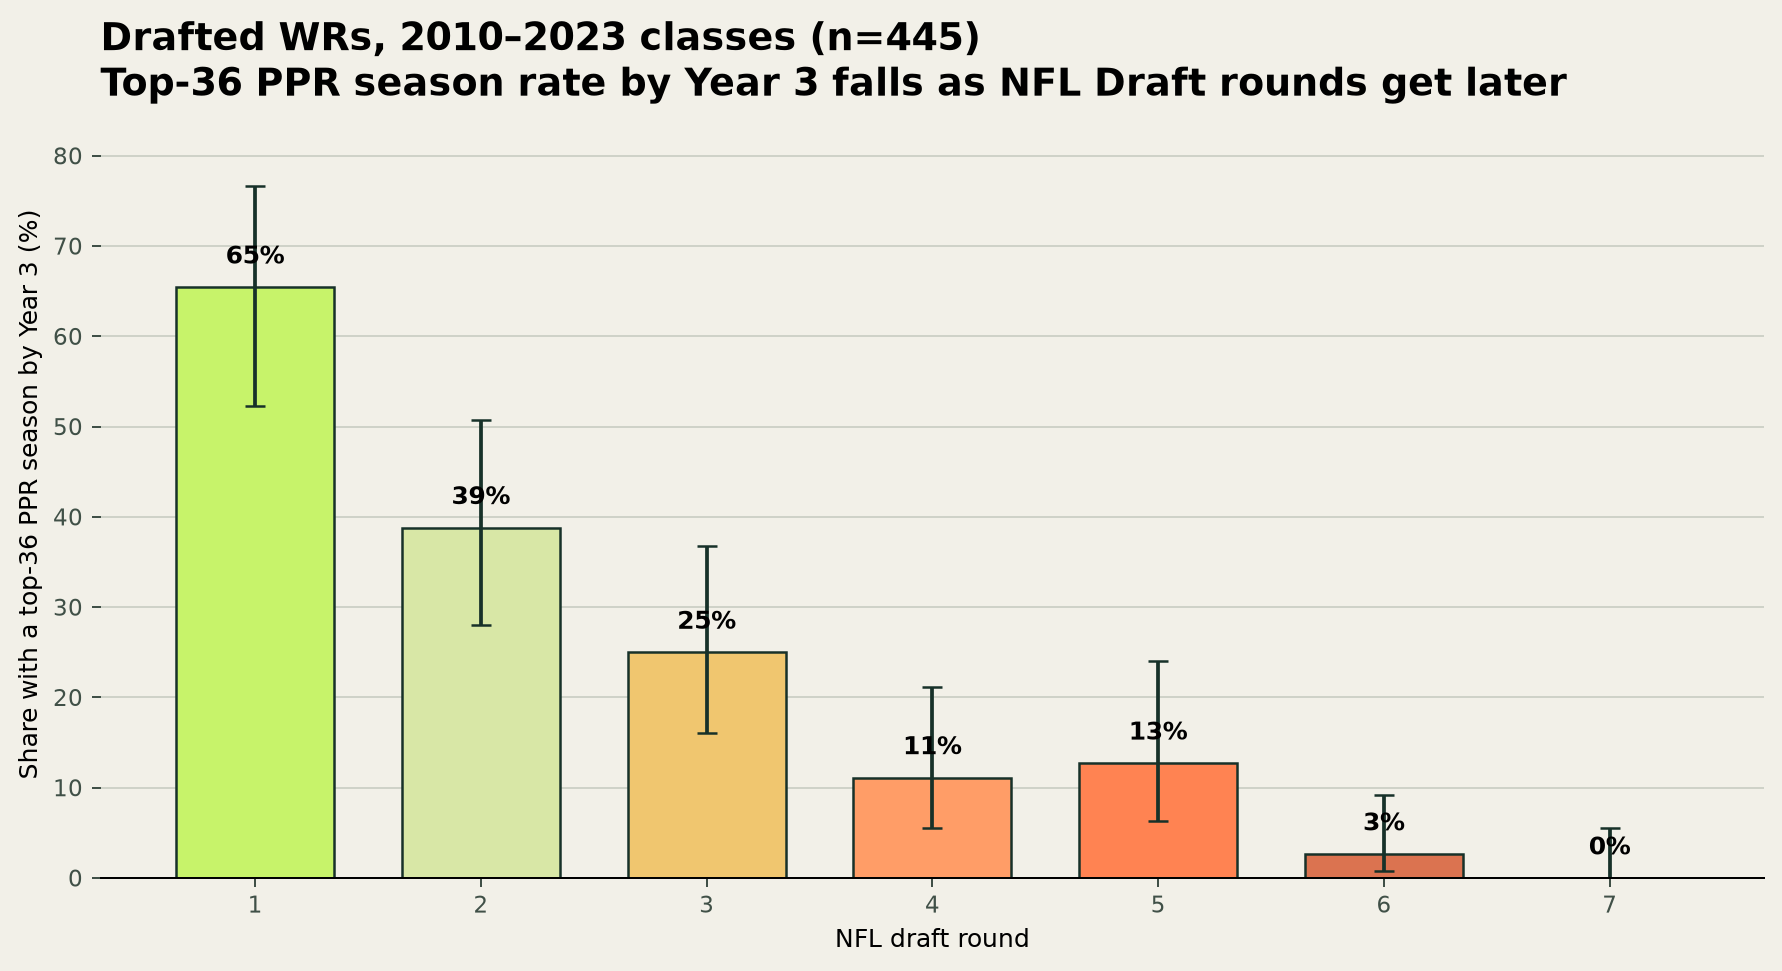
Among 55 first-round receivers, 65.5% hit. Across 259 players selected in Rounds 4–7, 6.2% hit. The corresponding 95% intervals were 52.3%–76.6% and 3.8%–9.8%.
Rookie WR hit rates fall sharply after Round 1
Round 2 hit at 38.8% and Round 3 at 25.0%. Just 2 of 75 Round 6 receivers reached a top-36 fantasy season by Year 3.
Those rates are not laws, but the decline is not a rounding artifact. Every 32 picks later multiplied the odds of a top-36 hit by 0.49 (95% CI: 0.42–0.58). That is an odds ratio, not a fixed change in probability.
Population All drafted WRs
Classes 2010–2023
Window Rookie season through Year 3
Primary hit Top-36 PPR finish
The draft-capital result holds at top-24 and top-12 thresholds
By Year 3, 54.5% of first-round receivers had a top-24 finish and 32.7% reached the top 12. Day 3 managed 3.1% and 1.5%.
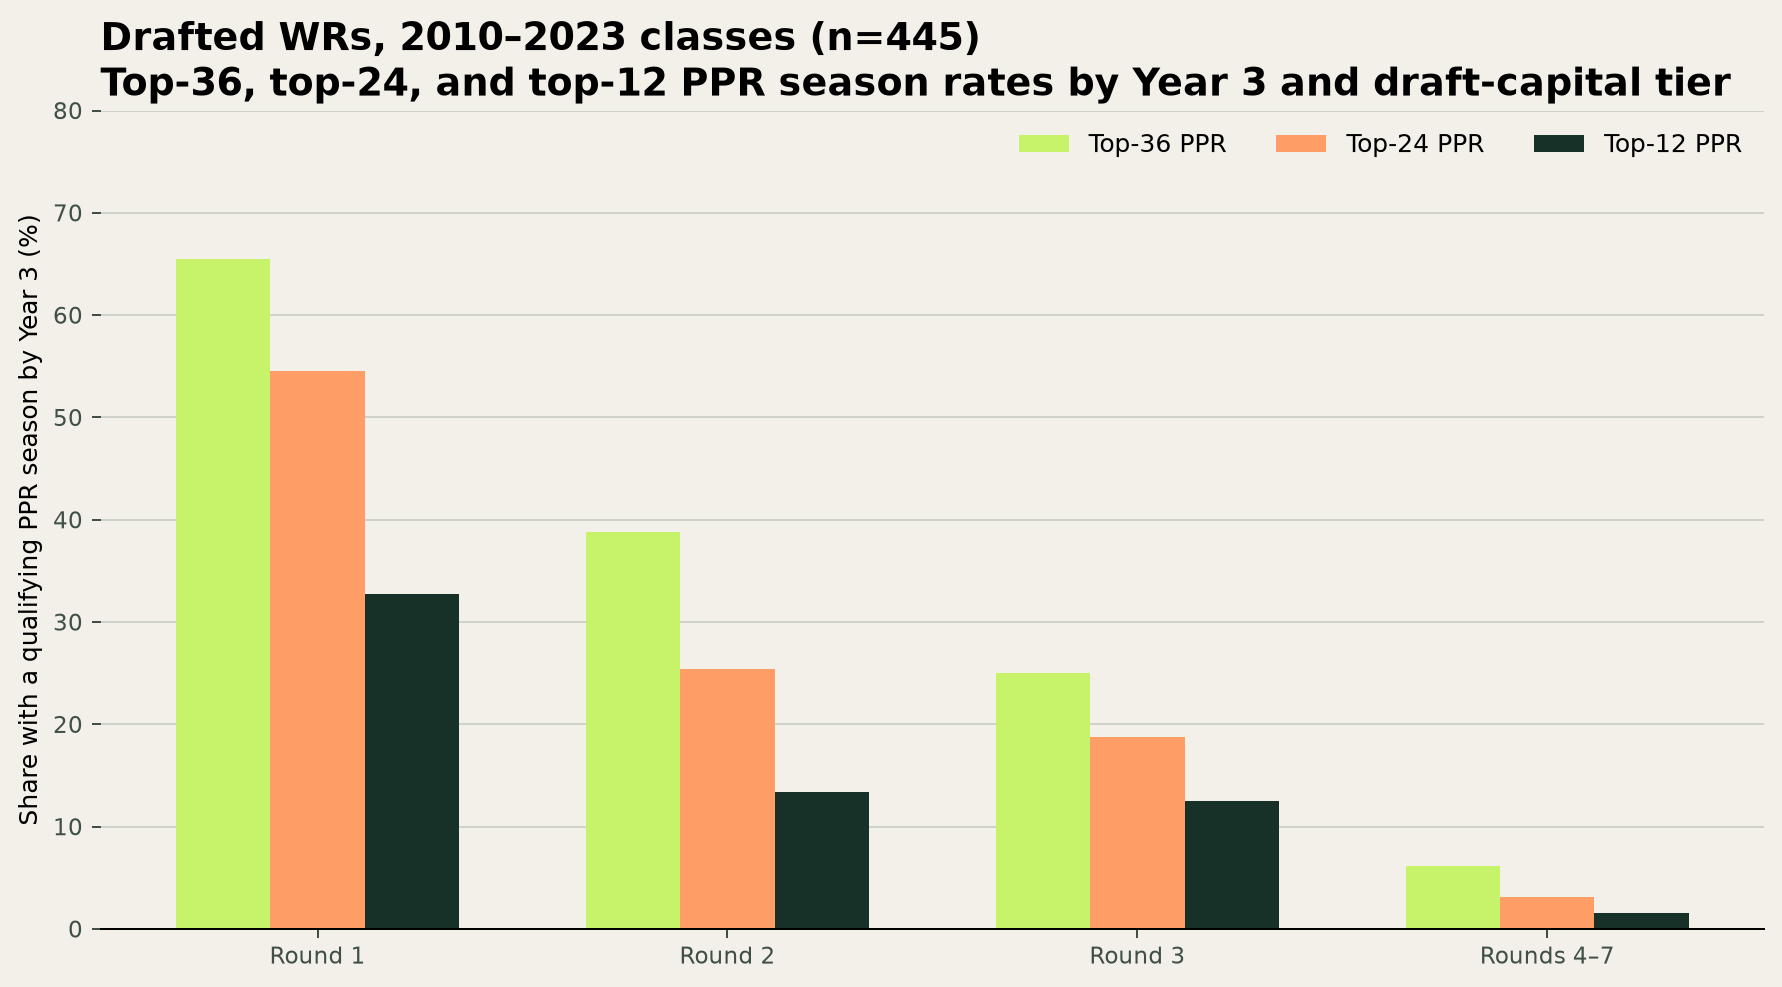
| Round | N | Rookie top 36 | By Y3 top 36 | By Y3 top 24 | By Y3 top 12 |
|---|---|---|---|---|---|
| Round 1 | 55 | 38.2% | 65.5% | 54.5% | 32.7% |
| Round 2 | 67 | 17.9% | 38.8% | 25.4% | 13.4% |
| Round 3 | 64 | 6.3% | 25.0% | 18.8% | 12.5% |
| Round 4 | 63 | 3.2% | 11.1% | 3.2% | 1.6% |
| Round 5 | 55 | 3.6% | 12.7% | 9.1% | 5.5% |
| Round 6 | 75 | 0.0% | 2.7% | 1.3% | 0.0% |
| Round 7 | 66 | 0.0% | 0.0% | 0.0% | 0.0% |
Use NFL Draft capital as a prior, not a verdict
Draft capital bundles team evaluation, athletic and production evidence, contract commitment, roster patience, and likely opportunity. That makes it valuable for prediction and dangerous for causal storytelling. Age, college production, landing spot, and price can update the prior; they should have to do real work to erase it.
The later the capital, the stronger the evidence—and the cheaper the price—should need to be.
METHODS · SOURCES · REVIEW TRAILOpen the Research File+
QUESTION
How often does a drafted wide receiver produce at least one top-36 PPR season by the end of Year 3, conditional on NFL draft round?
METHOD
- Complete cohort of 445 drafted wide receivers from 2010–2023.
- The primary outcome was locked as at least one top-36 PPR finish through Year 3.
- Top-24 and top-12 thresholds test whether the draft-capital ordering depends on the definition.
- Wilson intervals report uncertainty; a pick-level logistic model estimates the draft-position gradient.
LIMITS
- Top-36 PPR is a fantasy-utility threshold, not a universal definition of NFL success.
- Injuries, quarterback play, depth charts, and coaching are part of the outcome rather than controlled causes.
- Undrafted free agents are outside the target population.
- The study stops at the 2023 class so every player receives the same three-season window.
SOURCES
- nflverse draft picksCC BY 4.0 (nflverse compilation; underlying NFL data retain owner terms)
SHA-256 91f1ead0d531aec7e219e3f19756b3084d8ef6d8dbf37c8b4ec147dd3985c215 - nflverse player statsCC BY 4.0 (nflverse compilation; underlying NFL data retain owner terms)
SHA-256 45b06f7b7c88cf8338b239653eeb8063c0d4e4cd814de6f13d55e9ab88101de7 - nflverse 2025 regular-season player statisticsCC BY 4.0 (nflverse compilation; underlying NFL data retain owner terms)
SHA-256 aaa8559478dd8d58569c93e278239e70e9411e79ee649c99d8d506030cd42b12
DOWNLOADABLE DATA
REVIEW TRAIL
Statistics and figures are deterministic. The public run bundle records the review mode and publication decision.