If you're banking on a deep-threat receiver in a windy game, the data through 2024 says the targets should still come — but the production on those targets is where the risk lives.
The fantasy question here is whether wind kills the deep ball by shrinking volume or by degrading efficiency. Using 101 NFL regular-season games with observed winds of at least 15 mph against 807 games below 10 mph through the 2024 season, the answer is clearly the second: offenses kept attempting deep passes at the same rate, but those passes connected less often and produced less value when they did.
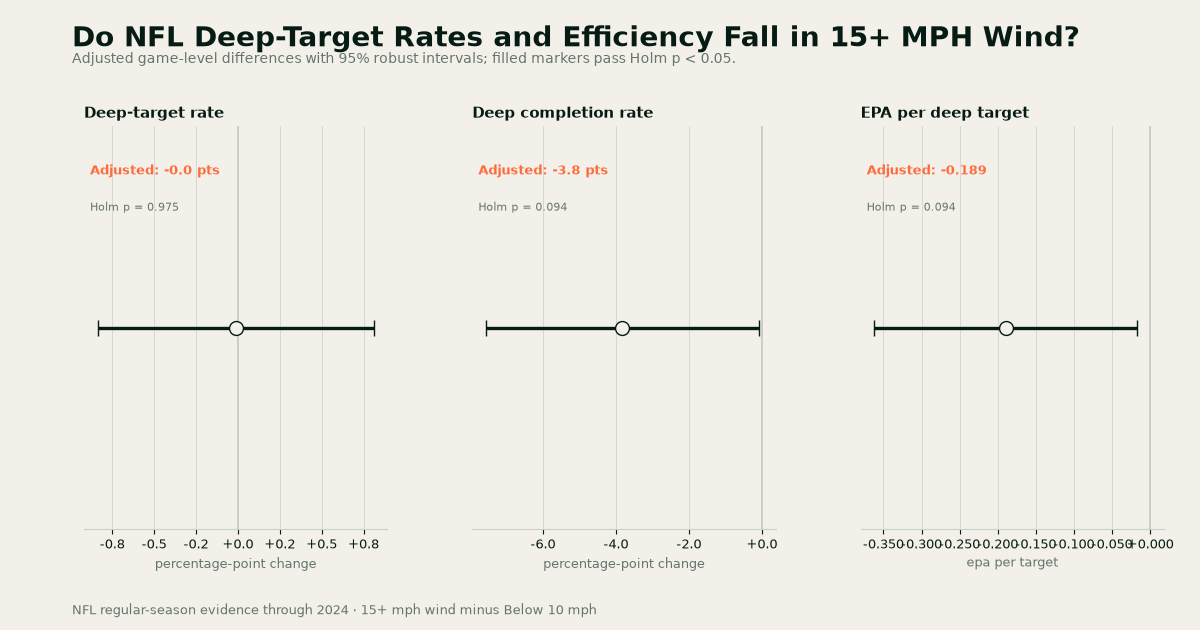
Deep-target rate — the share of pass attempts thrown deep — averaged 10.8% in 15+ mph wind games and 10.8% in below-10-mph games. The adjusted change was -0.0 points with a 95% interval from -0.8 to +0.8 points and a Holm-adjusted p-value of 0.975. That's a clean null result: wind does not appear to reduce how often teams try the deep ball.
Efficiency is a different story. Deep completion rate averaged 32.4% in windy games versus 36.1% in calm games, an adjusted drop of 3.8 points with a 95% interval from -7.6 to -0.1 points and a Holm-adjusted p-value of 0.094. EPA per deep target — a per-play value measure that credits expected points gained or lost on each throw — fell from 0.399 to 0.218, an adjusted change of -0.189 with a 95% interval from -0.362 to -0.017 and a Holm-adjusted p-value of 0.094. Both intervals exclude zero, though after correcting for testing three outcomes, neither clears the conventional 0.05 bar — so treat these as suggestive, not settled.
| Outcome | 15+ mph wind | Below 10 mph | Adjusted change | 95% interval | Holm p |
|---|---|---|---|---|---|
| Deep-target rate | 10.8% | 10.8% | -0.0 pts | -0.8 pts to +0.8 pts | 0.975 |
| Deep completion rate | 32.4% | 36.1% | -3.8 pts | -7.6 pts to -0.1 pts | 0.094 |
| EPA per deep target | 0.218 | 0.399 | -0.189 | -0.362 to -0.017 | 0.094 |
The pattern matters for how you weigh risk. A volume-based wind penalty would show up as fewer deep targets for your field-stretching receivers; that didn't happen. Instead, the penalty lands on outcomes — the same targets are being thrown, but fewer are completed and each is worth less on average. That's a hit to the ceiling of boom-or-bust deep threats specifically, not to their opportunity.
Two boundaries on this evidence. First, these are retrospective associations from observed game-window conditions — they don't establish causality and don't prove that a pregame wind forecast improves fantasy projections. Second, this is a game-level pattern, not a sit/start rule: it shouldn't override matchup, role, or usage considerations for any individual player.
METHODS · SOURCES · REVIEW TRAILOpen the Research File+
QUESTION
In NFL games with observed wind of at least 15 mph, do offenses attempt fewer deep passes or merely complete them less efficiently than below 10 mph?
METHOD
- Registered comparison of 101 games with observed wind of at least 15 mph against 807 games below 10 mph, NFL regular seasons through 2024.
- Adjusted game-level comparisons use week and season fixed effects plus air temperature as a control; unadjusted group means are reported alongside.
- Uncertainty is reported two ways: 4,000 game-level bootstrap draws and HC3 robust OLS 95% intervals; Holm adjustment covers the preregistered three-outcome family.
- Deep-target rate is defined for all 908 comparable games; deep completion rate and EPA per deep target are undefined in one comparable game with no eligible deep attempts.
- Play-by-play data from nflverse (CC BY 4.0); observed weather from NOAA Global Hourly stadium-adjacent station readings; stadium coordinates from Wikidata (CC0).
- Observed postgame conditions are retrospective evidence only and are never eligible as pregame projection inputs.
LIMITS
- Association only — no causal claim that wind causes the efficiency drop, since other game conditions could co-vary with windy games.
- Holm-adjusted p-values of 0.094 for both efficiency outcomes mean the differences are suggestive rather than conclusive at the conventional 0.05 threshold.
- The 101-game condition sample is modest; intervals are correspondingly wide.
- Weather data run through 2024, one season behind the play-by-play source.
- Game-level results should not be converted into automatic player-level sit/start decisions.
SOURCES
- nflverse NFL schedules and play-by-playCC BY 4.0
SHA-256 abd8ad1e4ddbf6cc1df651c0a038f809427de656e69fd488f1c4bd252a8c59ae - NOAA Global Hourly stadium observationsUS Government work; NOAA data are generally public domain
SHA-256 066a8418d7341118c7d34028997dbe39a77e2725349cf89883c5f576bf248658 - Wikidata stadium coordinatesCC0 1.0
SHA-256 ac17d4b5ea72b31f0c127cf570a79f961370090bb090864710fd34c17312afd4
DOWNLOADABLE DATA
REVIEW TRAIL
Statistics and figures come from deterministic code. The Research File contains the registration, provenance, specialist reviews, and gate decision.