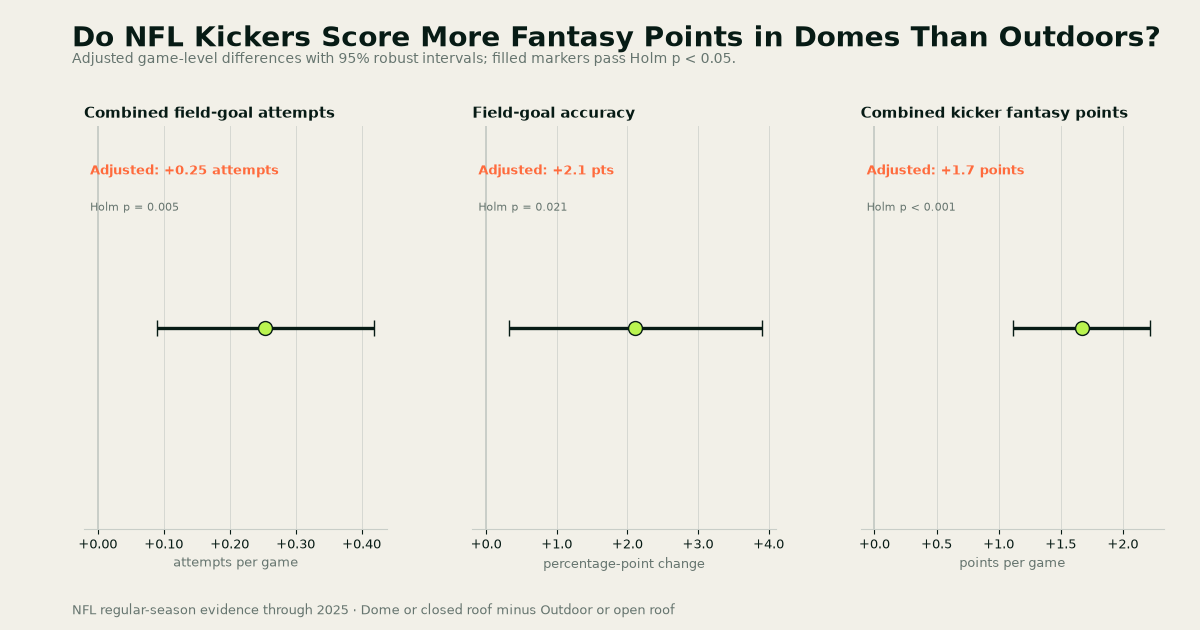
If you are weighing two kickers and one of them plays indoors, the roof association is real and measurable: across 2,127 comparable NFL regular-season games through 2025, the two kickers in a dome or closed-roof game combined for 17.4 fantasy points per game versus 15.6 outdoors — an adjusted difference of +1.7 points with a 95% interval from +1.1 to +2.2 points (Holm-adjusted p < 0.001). That headline number is combined across both teams' kickers, so the per-kicker share of the gap is roughly half of it.
That scoring gap is built from two smaller edges that point the same way. Teams attempted more field goals indoors: 4.06 combined attempts per game in dome or closed-roof games versus 3.80 outdoors, an adjusted difference of +0.25 attempts (95% interval +0.09 to +0.42, Holm-adjusted p = 0.005). And the kicks that were attempted went in more often: accuracy averaged 85.7% indoors versus 84.2% outdoors, an adjusted difference of +2.1 percentage points (95% interval +0.3 to +3.9, Holm-adjusted p = 0.021). The accuracy model also controls for average field-goal distance, so the gap is not simply a story about shorter indoor kicks.
| Outcome | Dome or closed roof | Outdoor or open roof | Adjusted change | 95% interval | Holm p |
|---|---|---|---|---|---|
| Combined field-goal attempts | 4.06 | 3.80 | +0.25 attempts | +0.09 attempts to +0.42 attempts | 0.005 |
| Field-goal accuracy | 85.7% | 84.2% | +2.1 pts | +0.3 pts to +3.9 pts | 0.021 |
| Combined kicker fantasy points | 17.4 | 15.6 | +1.7 points | +1.1 points to +2.2 points | <0.001 |
The accuracy edge is the weakest of the three findings. Its HC3 robust interval and Holm-adjusted p-value exclude zero, but the game-level bootstrap interval does not: the bootstrap 95% interval runs from -0.4 to +3.4 percentage points with a bootstrap p-value of 0.123. The attempts and scoring gaps hold up under both uncertainty methods. Treat the accuracy difference as suggestive rather than settled.
The sample behind these numbers is large and complete. The registered comparison covers 640 dome or closed-roof games and 1,487 outdoor or open-roof games through the 2025 season, with no rows excluded for missingness. Field-goal accuracy is undefined in the 27 comparable games where neither team attempted a field goal, so its denominators are 633 condition games and 1,467 control games. The attempts and fantasy-point outcomes use the full 2,127-game sample. The scoring model adjusts for week and season; the accuracy model adds average kick distance on top of those.
Two boundaries matter for how you use this. First, these are retrospective associations from observed game conditions, not causal proof — teams that play in domes may differ from outdoor teams in ways that confound the comparison, and the study cannot separate the roof itself from franchise composition. Second, the roof status here is what was recorded after the fact; it is not a pregame forecast input, and this study does not show that forecasting a closed roof improves projections. The broad venue classification also cannot tell you what happens when a retractable roof is opened versus closed on the same day.
What the evidence supports: across three preregistered outcomes, every adjusted difference favors the indoor environment, and the attempts and scoring gaps are robust under both the HC3 robust intervals and the Holm-adjusted p-values. The accuracy gap clears that bar only on the robust interval and Holm p-value, not the bootstrap. For fantasy purposes, the practical takeaway is that a dome or closed-roof game has historically come with roughly 1.7 more combined kicker fantasy points per game, driven mainly by more attempts and, more tentatively, better accuracy.
METHODS · SOURCES · REVIEW TRAILOpen the Research File+
QUESTION
After accounting for kick distance and game environment, how much does a dome or closed roof change NFL kicker attempts, accuracy, and fantasy scoring compared with outdoor or open-roof games?
METHOD
- Registered contrast: fixed/retractable roof recorded closed or dome versus outdoor/open, using nflverse schedule and play-by-play data through the 2025 season (CC BY 4.0, hashed completed-season release assets).
- Adjusted comparisons use OLS with HC3 robust standard errors; the attempts and fantasy-point models control for week and season fixed effects, and the accuracy model additionally controls for average field-goal distance.
- Uncertainty is reported as 95% HC3 robust intervals alongside 4,000 game-level bootstrap draws; Holm-adjusted p-values cover the preregistered three-outcome family. The accuracy outcome's bootstrap interval includes zero (lower bound -0.004, p = 0.123), so its exclusion of zero rests on the HC3 interval and Holm-adjusted p-value.
- Denominators: 2,127 comparable games (640 condition, 1,487 control) for attempts and fantasy points; accuracy excludes 27 games with no field-goal attempt (633 condition, 1,467 control).
- Reproducibility: bootstrap seeds derived per outcome from SHA-256 of the study and outcome labels; two complete analysis executions produced identical result hashes.
- Limitations: association only, no causal claim; observed postgame roof status is not a pregame forecast input; franchise composition may confound the roof association; the broad venue classification does not resolve open-versus-closed retractable-roof effects; combined kicker fantasy points are per game across both teams, not a single kicker's output.
LIMITS
- These are observed associations and do not establish that the roof caused the scoring difference.
- Observed postgame conditions cannot be used as a pregame forecast feature; this study does not evaluate forecast value.
- Team and franchise composition may confound the roof association.
- The venue classification cannot distinguish retractable-roof open-versus-closed effects within the same stadium.
- Combined kicker fantasy points are per game across both teams, not a single kicker's output.
- The accuracy gap's bootstrap interval includes zero; only the HC3 robust interval and Holm-adjusted p-value exclude zero for that outcome.
SOURCES
- nflverse NFL schedules and play-by-playCC BY 4.0
SHA-256 abd8ad1e4ddbf6cc1df651c0a038f809427de656e69fd488f1c4bd252a8c59ae
DOWNLOADABLE DATA
REVIEW TRAIL
Statistics and figures come from deterministic code. The Research File contains the registration, provenance, specialist reviews, and gate decision.