Kicking environments are not created equal — or at least the kicks aren't. We measured every NFL regular-season field-goal attempt from 2018 through the completed 2025 season (8,241 kicks, league make rate 84.6%) against a leave-one-season-out expectation built only from kick distance and season, then ranked stadiums by how many makes they produced above or below that expectation.
The headline ranking
Among the 28 eligible stadiums (at least 80 attempts and 40 games), the largest positive adjusted residuals per attempt belong to Allegiant Stadium (+0.0660, 95% CI 0.0039 to 0.0861, 214 attempts), AT&T Stadium (+0.0543, 95% CI -0.0025 to 0.0819, 272 attempts), Mercedes-Benz Stadium (+0.0444, 95% CI 0.0020 to 0.0646, 301 attempts), and SoFi Stadium (+0.0419, 95% CI 0.0055 to 0.0617, 407 attempts). On the negative side, the biggest deficits are FirstEnergy Stadium (-0.0675, 95% CI -0.1002 to 0.0066, 226 attempts), Gillette Stadium (-0.0617, 95% CI -0.0885 to 0.0008, 245 attempts), and Raymond James Stadium (-0.0544, 95% CI -0.0753 to -0.0029, 255 attempts).
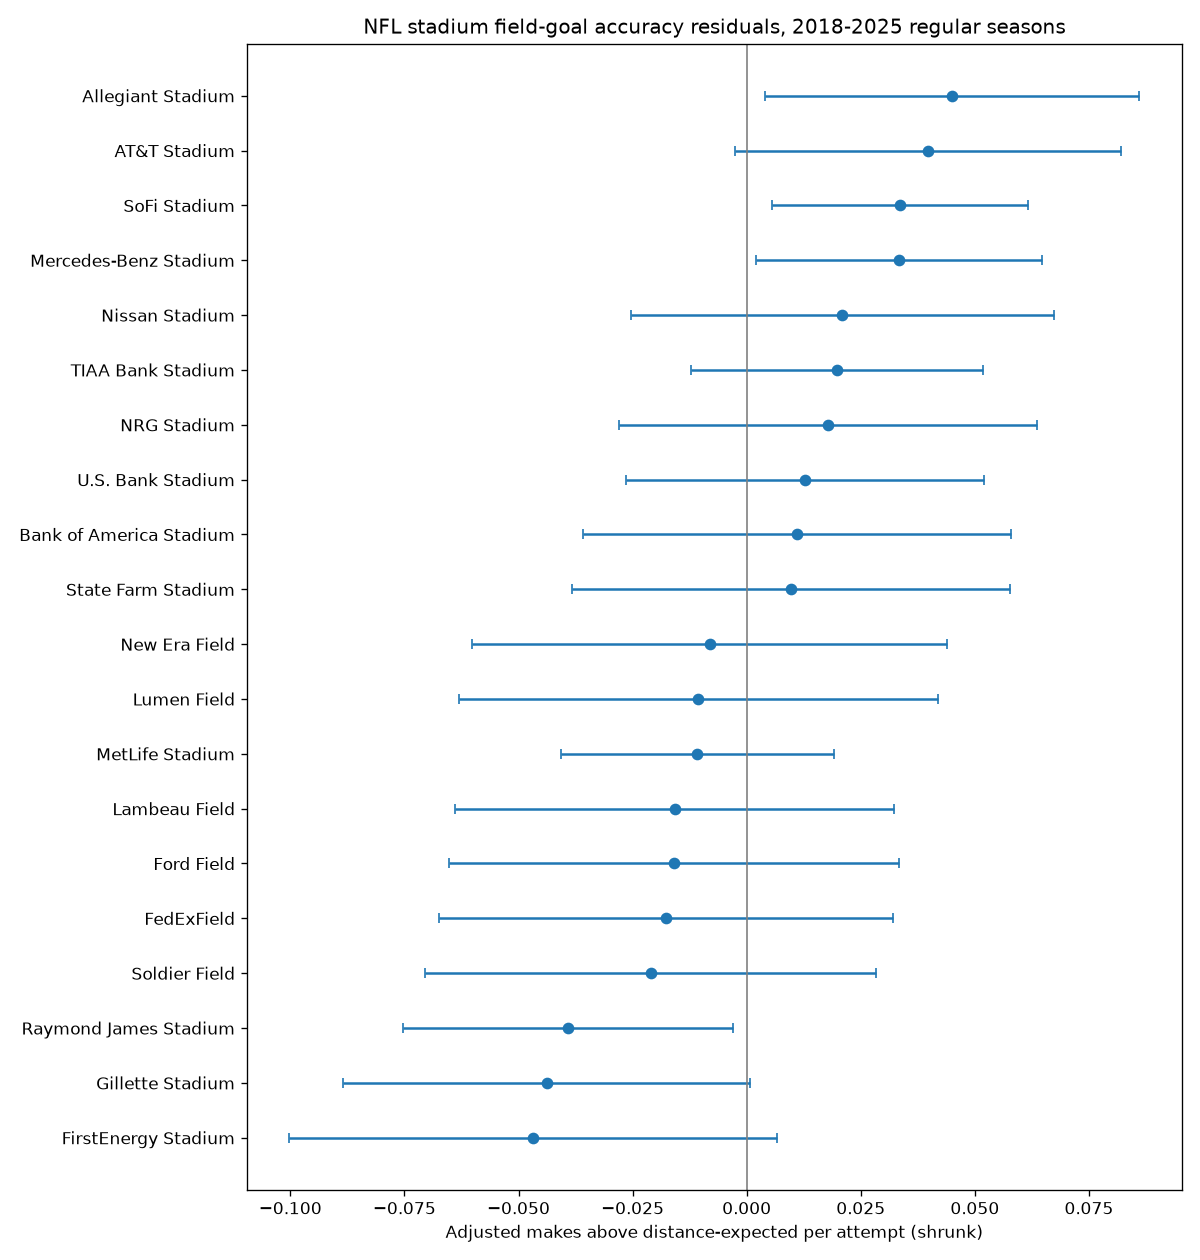
| stadium | games | attempts | make_pct | residual_per_attempt | shrunk_residual | ci95_low | ci95_high | holm_p | significant |
|---|---|---|---|---|---|---|---|---|---|
| Allegiant Stadium | 51 | 214 | 0.9019 | 0.066 | 0.045 | 0.0039 | 0.0861 | 0.857578 | no |
| AT&T Stadium | 66 | 272 | 0.8897 | 0.0543 | 0.0397 | -0.0025 | 0.0819 | 1 | no |
| SoFi Stadium | 101 | 407 | 0.8845 | 0.0419 | 0.0336 | 0.0055 | 0.0617 | 0.535364 | no |
| Mercedes-Benz Stadium | 65 | 301 | 0.8804 | 0.0444 | 0.0333 | 0.002 | 0.0646 | 0.921926 | no |
| Nissan Stadium | 66 | 231 | 0.8831 | 0.03 | 0.021 | -0.0254 | 0.0673 | 1 | no |
| TIAA Bank Stadium | 62 | 243 | 0.8807 | 0.028 | 0.0198 | -0.0122 | 0.0519 | 1 | no |
| NRG Stadium | 67 | 270 | 0.863 | 0.0244 | 0.0178 | -0.028 | 0.0636 | 1 | no |
| U.S. Bank Stadium | 65 | 285 | 0.8561 | 0.0173 | 0.0128 | -0.0265 | 0.052 | 1 | no |
| Bank of America Stadium | 65 | 255 | 0.8627 | 0.0153 | 0.011 | -0.0358 | 0.0579 | 1 | no |
| State Farm Stadium | 68 | 270 | 0.8444 | 0.0134 | 0.0098 | -0.0382 | 0.0578 | 1 | no |
| M&T Bank Stadium | 67 | 264 | 0.8598 | 0.0109 | 0.0079 | -0.0313 | 0.0472 | 1 | no |
| Levi's Stadium | 63 | 215 | 0.8651 | 0.0108 | 0.0073 | -0.0429 | 0.0575 | 1 | no |
| Empower Field at Mile High | 59 | 250 | 0.848 | 0.004 | 0.0028 | -0.0369 | 0.0426 | 1 | no |
| GEHA Field at Arrowhead Stadium | 42 | 160 | 0.8562 | 0.0013 | 0.0008 | -0.0533 | 0.0549 | 1 | no |
| Hard Rock Stadium | 67 | 260 | 0.8346 | -0.0002 | -0.0002 | -0.0371 | 0.0367 | 1 | no |
| Lucas Oil Stadium | 67 | 255 | 0.8353 | -0.0005 | -0.0004 | -0.0379 | 0.0372 | 1 | no |
| Mercedes-Benz Superdome | 64 | 254 | 0.8346 | -0.0072 | -0.0052 | -0.0504 | 0.04 | 1 | no |
| Lincoln Financial Field | 65 | 230 | 0.8391 | -0.0081 | -0.0056 | -0.0473 | 0.036 | 1 | no |
| New Era Field | 65 | 212 | 0.8491 | -0.012 | -0.0081 | -0.0601 | 0.0438 | 1 | no |
| Lumen Field | 46 | 210 | 0.8333 | -0.0156 | -0.0106 | -0.063 | 0.0418 | 1 | no |
| MetLife Stadium | 133 | 542 | 0.8358 | -0.0128 | -0.0108 | -0.0407 | 0.0191 | 1 | no |
| Lambeau Field | 65 | 228 | 0.8246 | -0.0226 | -0.0157 | -0.0638 | 0.0323 | 1 | no |
| Ford Field | 67 | 243 | 0.8107 | -0.0225 | -0.016 | -0.0652 | 0.0333 | 1 | no |
| FedExField | 66 | 247 | 0.8178 | -0.0249 | -0.0177 | -0.0674 | 0.032 | 1 | no |
| Soldier Field | 65 | 238 | 0.8361 | -0.0299 | -0.021 | -0.0704 | 0.0284 | 1 | no |
| Raymond James Stadium | 64 | 255 | 0.8039 | -0.0544 | -0.0391 | -0.0753 | -0.0029 | 0.886754 | no |
| Gillette Stadium | 66 | 245 | 0.7959 | -0.0617 | -0.0438 | -0.0885 | 0.0008 | 1 | no |
| FirstEnergy Stadium | 67 | 226 | 0.7743 | -0.0675 | -0.0468 | -0.1002 | 0.0066 | 1 | no |
What the intervals actually say
Per the deterministic exclusion summary, exactly three eligible stadiums have 95% intervals excluding zero on the positive side — Allegiant, Mercedes-Benz, and SoFi — and exactly one excludes zero on the negative side: Raymond James. But none of the 28 eligible stadiums is flagged significant under the Holm correction across the full family; the smallest Holm-adjusted p-value is 0.535 (SoFi). Treat these as suggestive stadium effects, not statistically confirmed ones.
How stable is the ranking?
The ordering holds up well to most stress tests: eligibility thresholds of 60 and 120 attempts each give Spearman 1.0 versus the primary ranking with full top-5 and bottom-5 overlap, alternate distance binning gives Spearman 0.996, and turning shrinkage on or off gives 0.998. The one soft spot is the time window: restricting to 2021–2025 drops rank stability to Spearman 0.844 with only 4/5 top-5 and 3/5 bottom-5 overlap, so the 2018–2025 ordering may not reflect the most recent seasons alone.
| sensitivity | eligible_stadiums | spearman_vs_primary | top5_overlap | bottom5_overlap |
|---|---|---|---|---|
| threshold_60 | 28 | 1 | 5 | 5 |
| threshold_120 | 28 | 1 | 5 | 5 |
| alternate_distance_bins | 28 | 0.9962 | 5 | 4 |
| window_2021_plus | 28 | 0.844 | 4 | 3 |
| shrinkage_on_vs_off | 28 | 0.9984 | 5 | 5 |
Why it matters for fantasy
If you're weighing two kickers with similar leg strength and matchups, a road game in Las Vegas, Dallas, Atlanta, or Los Angeles has historically come with a small accuracy tailwind after distance is accounted for, while trips to Cleveland, New England, or Tampa have come with a headwind. The effect sizes are modest — roughly five to seven makes per 100 attempts at the extremes — and because no stadium survives Holm correction, this is a tiebreaker, not a reason to bench a clearly better kicker. The adjustment controls only for distance and season, so residual 'stadium' effects may partly reflect unmodeled weather or venue characteristics rather than the building itself.
Caveats worth knowing
- 17 of the 45 analyzed stadiums are ineligible for the primary ranking (fewer than 80 attempts or 40 games), including several with extreme point estimates on tiny samples — Deutsche Bank Park at -0.221 per attempt on 5 kicks, Arena Corinthians at -0.105 on 6 — whose intervals are degenerate or extremely wide and cannot support inference.
- The expectation model uses only kick-distance bins and training-season outcomes; stadium identity never enters it, and raw per-stadium make percentage is reported for transparency only, never for ranking.
- Uncertainty comes from 200 game-clustered bootstrap resamples with 95% intervals and Holm-adjusted p-values across the 28 eligible stadiums; shrinkage toward the league mean used a pre-locked rule (k = 100).
The bottom line
After adjusting for kick distance and season across the 2018–2025 regular seasons, Allegiant Stadium shows the largest positive field-goal residual among eligible stadiums and FirstEnergy Stadium the largest negative, with only Allegiant, Mercedes-Benz, and SoFi clearing zero on the upside and only Raymond James on the downside. Because no stadium survives Holm correction, use these splits as a soft tiebreaker when comparing otherwise similar kickers and matchups — not as a reason to override a clear talent or workload edge.
METHODS · SOURCES · REVIEW TRAILOpen the Research File+
QUESTION
After accounting for kick distance and season, which NFL stadiums have produced the largest positive and negative field-goal accuracy residuals since 2018?
METHOD
- Population: all NFL regular-season field-goal attempts, 2018 through the completed 2025 season (8,241 kicks); the partial 2026 season is excluded entirely.
- Expectation: leave-one-season-out distance-and-season model with 9 distance bins (minimum 20 kicks per bin, 0 merges, 0 fallback uses); stadium identity never enters the model.
- Ranking: adjusted residual per attempt, shrunk toward the league mean with a pre-locked empirical-Bayes rule (k = 100).
- Uncertainty: 200 game-clustered bootstrap resamples (seed 42), 95% intervals, Holm correction across the 28 eligible stadiums.
- Sensitivity: eligibility thresholds of 60 and 120 attempts, alternate distance bins, a 2021–2025 window, and shrinkage on versus off.
- Sources: nflverse release assets (games.csv, play-by-play 2018–2025) under CC BY 4.0, downloaded fresh with SHA-256 hashes recorded.
LIMITS
- No eligible stadium survives Holm correction, so all stadium effects are suggestive rather than statistically confirmed.
- Rank stability weakens in the 2021–2025 window (Spearman 0.844), so the full-window ordering may not match recent seasons.
- The adjustment controls only for kick distance and season; roof, surface, temperature, and wind were descriptive context only, so residuals may partly reflect unmodeled weather or venue characteristics.
- 17 of 45 stadiums are ineligible for ranking due to small samples, including several with extreme but uninferable point estimates.
SOURCES
- nflverse NFL schedulesCC BY 4.0
SHA-256 93522f71018c7ea64cc5e49f394e38f843dc24e53916a425f4d7b0be1f4a603d - nflverse 2018 play-by-playCC BY 4.0
SHA-256 d37899610b397b96a90da6902827de5b46c5457b93e0e16d5f95a8eb524e4a7d - nflverse 2019 play-by-playCC BY 4.0
SHA-256 b764668137052be23745953cbc33fa17e537a70c81e9b73785a19a15e7288216 - nflverse 2020 play-by-playCC BY 4.0
SHA-256 bc954b5780e325df4faa255fac092585c981a4de5d2f553a8a4e0a3c8b3a3cf2 - nflverse 2021 play-by-playCC BY 4.0
SHA-256 e8743a568f99667a8bdcd29ba12224ee1782ad2b7916bee78ee335c099383739 - nflverse 2022 play-by-playCC BY 4.0
SHA-256 0c69a71eb39498956c7b1d5c1ca52ce7fe679934a95d1af249facb5ea9829ea4 - nflverse 2023 play-by-playCC BY 4.0
SHA-256 4649804ee0f0a40b41e51ec75a1ce921949d7fab5459213488656b92f78560e8 - nflverse 2024 play-by-playCC BY 4.0
SHA-256 23370d5d10f8104d80d46a1fc5e61f4f6f5a3263fe96fe2dd629913cfcb08c06 - nflverse 2025 play-by-playCC BY 4.0
SHA-256 2f135887790a013fd004e609e37096bb4816d5cc80b9f19122e1bad478961978
DOWNLOADABLE DATA
REVIEW TRAIL
Statistics and figures come from deterministic code. The Research File contains the registration, provenance, specialist reviews, and gate decision.