If you bench or trade a player because a windy forecast is coming, the historical record through the 2024 NFL season offers no support for the idea that 15+ mph wind makes fantasy scoring more volatile. In a registered comparison of 101 windy games against 806 calm games, none of the five position-group outcomes showed a reliable change in scoring spread once week, season, temperature, and team composition were held constant.
Every fantasy manager has heard the advice: wind makes fantasy outcomes wild, so expect boom-or-bust scoring from your QB, RB, WR, TE, or kicker in a gusty game. We tested that claim directly. The result: the windy-game volatility story is a myth, at least for the games we could measure. No position group showed a reliable widening of its scoring spread in 15+ mph wind, and the point estimates were small enough that even the largest ones sit comfortably inside statistical noise.
Before reading the numbers, one definition matters. Volatility here means absolute deviation: how far a game's combined position-group fantasy points sat from that season-week's median across the league. A bigger deviation means the game strayed further from a typical slate — wider dispersion, not necessarily more upside. We compared games with observed winds of at least 15 mph against games below 10 mph, using 101 windy games and 806 calm games through the 2024 NFL season, and adjusted for week, season, air temperature, and the home and away teams.
| Outcome | 15+ mph wind | Below 10 mph | Adjusted change | 95% interval | Holm p |
|---|---|---|---|---|---|
| QB PPR absolute deviation from the weekly median | 8.6 | 9.0 | -0.6 points | -2.4 points to +1.1 points | 1.000 |
| RB PPR absolute deviation from the weekly median | 11.7 | 10.0 | +1.2 points | -1.0 points to +3.5 points | 1.000 |
| WR PPR absolute deviation from the weekly median | 14.5 | 15.7 | -2.1 points | -5.1 points to +0.9 points | 0.874 |
| TE PPR absolute deviation from the weekly median | 8.7 | 8.8 | -0.3 points | -2.0 points to +1.3 points | 1.000 |
| Kicker points absolute deviation from the weekly median | 4.3 | 4.3 | +0.0 points | -0.8 points to +0.8 points | 1.000 |
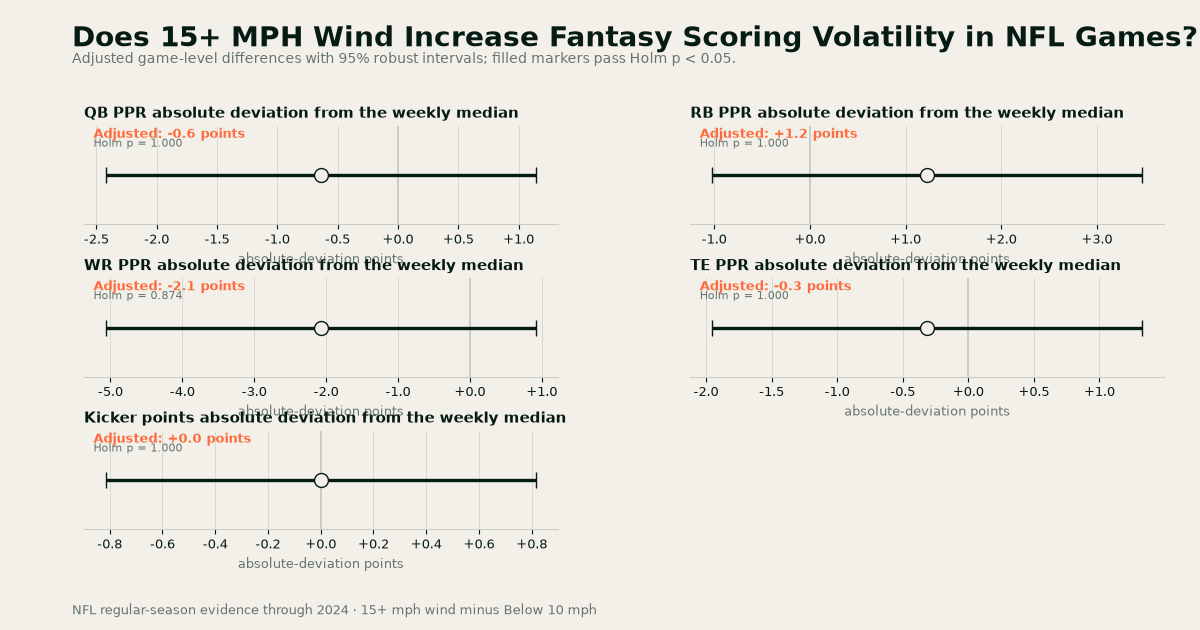
The supported differences are all small and none clears the statistical bar. QBs in windy games averaged 8.6 points of deviation versus 9.0 in calm games — an adjusted change of -0.6 points with a 95% interval from -2.4 to +1.1 and a Holm-adjusted p-value of 1.000. RBs averaged 11.7 versus 10.0, an adjusted change of +1.2 points with an interval from -1.0 to +3.5 and a Holm-adjusted p-value of 1.000. WRs actually averaged slightly less deviation in wind: 14.5 versus 15.7, an adjusted change of -2.1 points with an interval from -5.1 to +0.9 and a Holm-adjusted p-value of 0.874. TEs (8.7 vs 8.8, adjusted change -0.3, interval -2.0 to +1.3, Holm p 1.000) and kickers (4.3 vs 4.3, adjusted change +0.0, interval -0.8 to +0.8, Holm p 1.000) were essentially unchanged.
Those are null results, and they should be read as nulls. The RB estimate points toward slightly wider dispersion in wind, but its interval spans zero and the Holm-adjusted p-value is 1.000, so the data cannot distinguish it from no difference. The WR estimate points the other direction, toward slightly tighter scoring in wind, and it also fails the significance test. Nothing here supports treating a windy game as a volatility event for any position.
Two boundaries on the evidence. First, these are retrospective associations from observed game conditions — they do not establish that wind causes anything, and they do not prove that a pregame wind forecast improves your projections. Second, the wind readings are observed conditions from games already played, not a forecast input you can plug into a lineup tool. What the study does support is narrower: in the games actually played through 2024, high wind did not come with wider fantasy scoring spreads at any position.
The practical takeaway for draft, waiver, trade, or lineup decisions is that the windy-game volatility narrative has no backing in this evidence. If you have been pricing a wind premium into your volatility expectations, the registered comparison through 2024 says the premium is not there.
METHODS · SOURCES · REVIEW TRAILOpen the Research File+
QUESTION
In NFL games with observed wind of at least 15 mph, do position-group fantasy totals vary more from the weekly median than in games below 10 mph?
METHOD
- Registered comparison of 101 games with observed winds of at least 15 mph against 806 games below 10 mph, drawn from 907 comparable NFL regular-season games through the 2024 season.
- Volatility measured as each game's combined position-group fantasy points minus that season-week's median, taken as an absolute value; QB, RB, WR, TE, and kicker reported separately.
- Adjusted differences estimated with week and season fixed effects, air temperature, and home and away team fixed effects, using HC3 robust standard errors; 4,000 game-level bootstrap draws per outcome.
- Holm correction applied across the preregistered five-outcome family; all adjusted p-values reported beside their estimates.
- Data: nflverse schedules, play-by-play, and weekly player statistics (CC BY 4.0); NOAA Global Hourly stadium observations (public domain); Wikidata stadium coordinates (CC0 1.0). Weather observations available through the 2024 season; the study stops at the latest usable source season.
- Sensitivity checks passed: station agreement (paired-station wind mean absolute difference within 2.5 m/s across at least 1,000 games), weekly position-scoring coverage of at least 99.9% of completed games, per-outcome denominator reconciliation, and deterministic bootstrap reproduction across two complete executions.
- Limitations: retrospective association only; observed postgame conditions are not eligible as pregame projection inputs; no causal claims.
LIMITS
- These are observed associations, not causal effects.
- Observed game conditions cannot be used as a pregame forecast claim.
- Weather observations run through the 2024 season; the study does not cover 2025 games.
SOURCES
- nflverse NFL schedules, play-by-play, and weekly player statisticsCC BY 4.0
SHA-256 968c9f8a588b385231fd9a411a63167b35de4f6d14da1fa6efaaf2a47fd4dbaf - NOAA Global Hourly stadium observationsUS Government work; NOAA data are generally public domain
SHA-256 066a8418d7341118c7d34028997dbe39a77e2725349cf89883c5f576bf248658 - Wikidata stadium coordinatesCC0 1.0
SHA-256 ac17d4b5ea72b31f0c127cf570a79f961370090bb090864710fd34c17312afd4
DOWNLOADABLE DATA
REVIEW TRAIL
Statistics and figures come from deterministic code. The Research File contains the registration, provenance, specialist reviews, and gate decision.