Expected touchdowns cut next-season forecast error by 11.7%, but they remain a tiebreaker—not a complete projection.
Fantasy analysis says “touchdown regression” so often that it can become a substitute for analysis. We tested the useful version of the claim: does an opportunity-based baseline predict next season better than a player’s raw touchdown total?
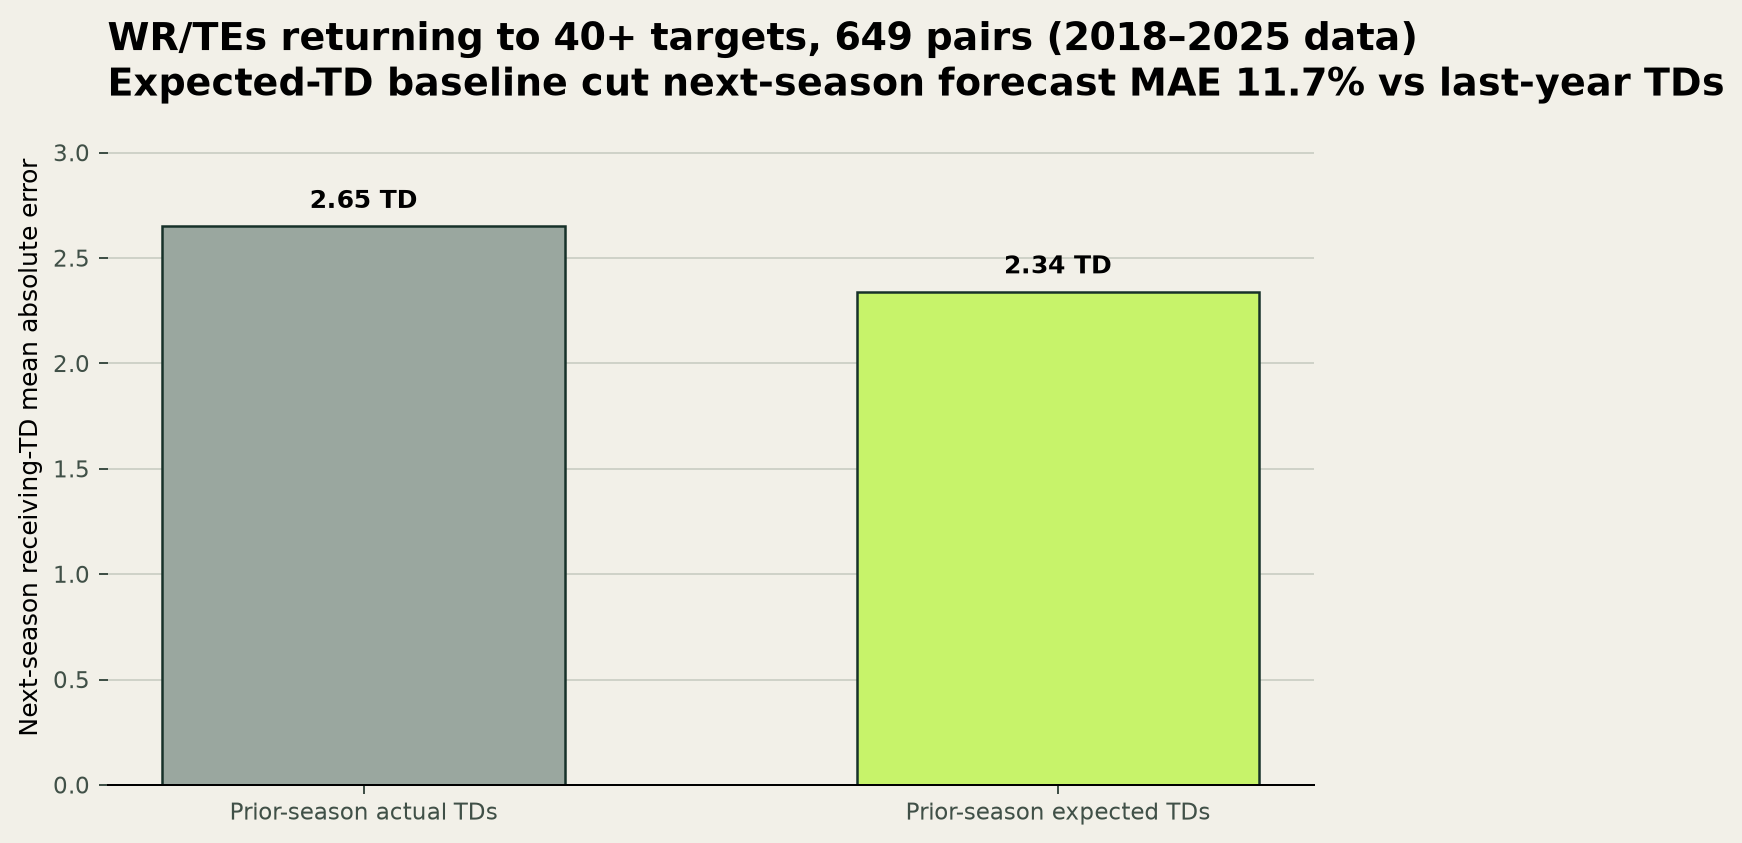
Across 649 consecutive WR/TE season pairs, carrying forward actual touchdowns missed by 2.65 touchdowns on average. Expected touchdowns cut that error to 2.34, an 11.7% improvement.
The biggest touchdown outliers regressed immediately
The biggest overperformers scored 8.3 touchdowns in year one and 5.3 the next—a drop of 3.0. The biggest underperformers moved the other way, from 2.9 to 4.4.
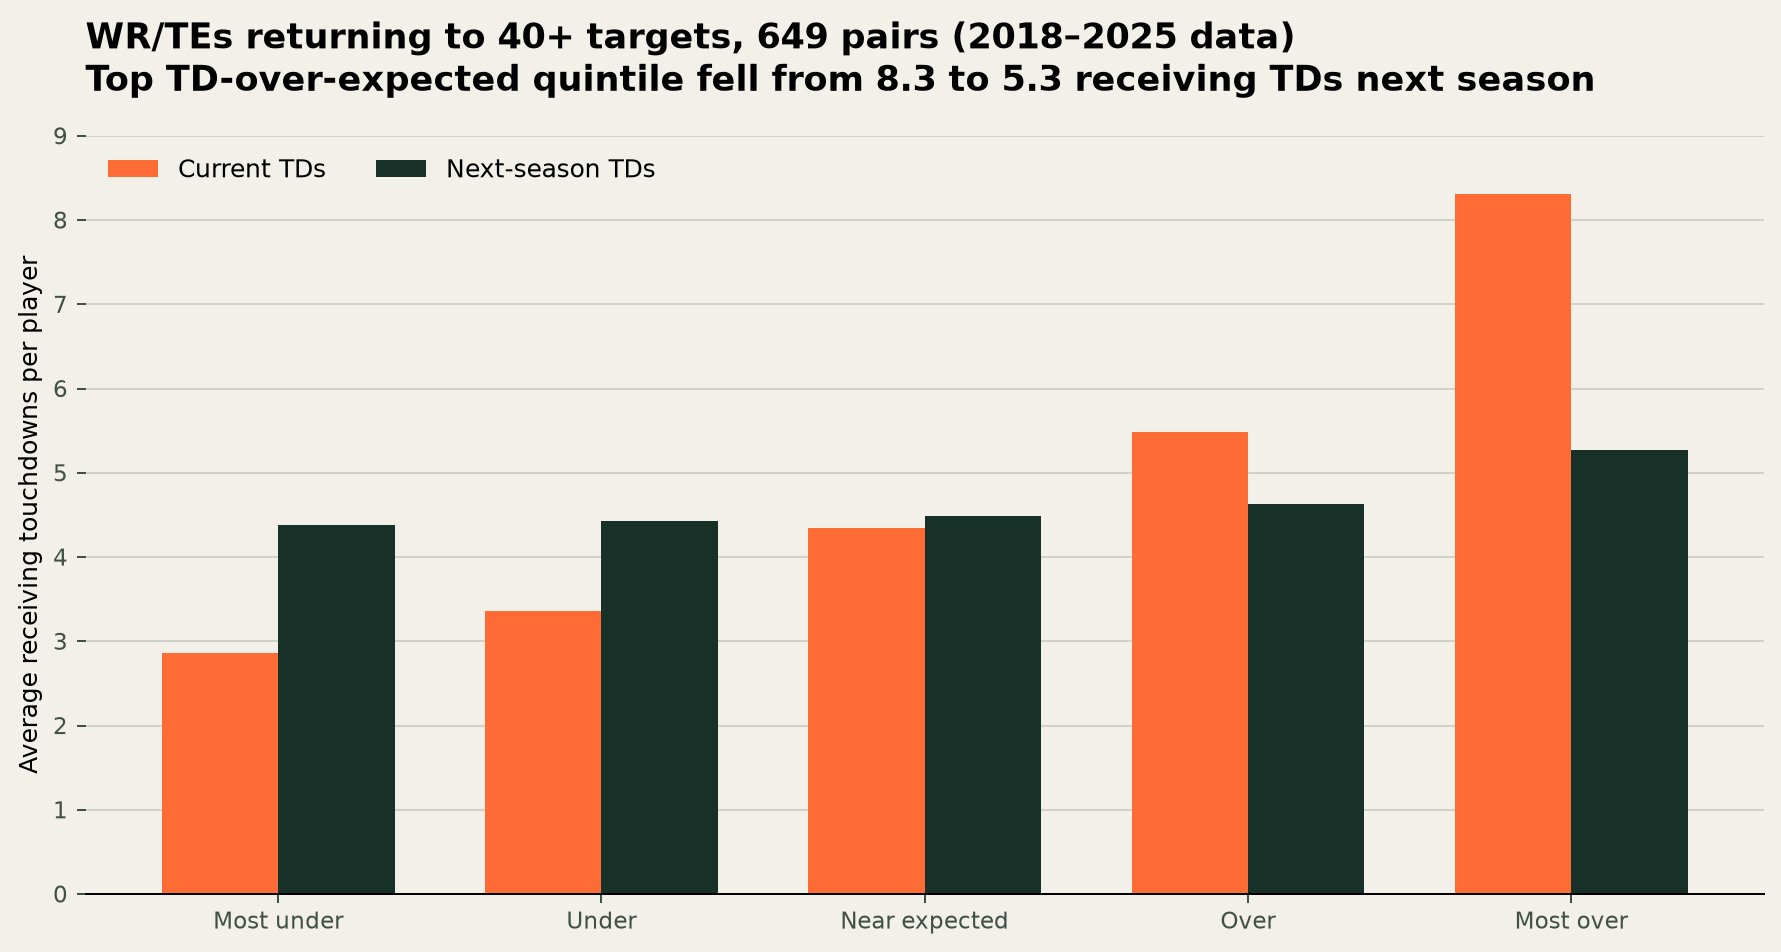
That is the useful core of regression. High-touchdown players are not automatically bad bets. The part of scoring unexplained by repeatable opportunity should simply receive less weight.
How the expected-touchdown test worked
We aggregated regular-season receiving data for wide receivers and tight ends with at least 40 targets from 2014–2025. Every test season from 2018 onward was trained only on earlier seasons. Targets, receptions, yards, air yards, and first downs estimated the scoring baseline.
Population WR/TE, at least 40 targets
Training Expanding window
Tests 2018–2025
Seed 4,444
The paired improvement was 0.31 touchdowns, with a 95% bootstrap interval of 0.18 to 0.45. Both forecasts still missed by more than two touchdowns, so this is a modest benchmark win—not a full player projection.
Expected and actual TDs across the full sample
| TD − xTD group | N | Current TD | xTD | Next TD |
|---|---|---|---|---|
| Most under | 130 | 2.9 | 5.5 | 4.4 |
| Under | 130 | 3.4 | 4.6 | 4.4 |
| Near expected | 129 | 4.3 | 4.5 | 4.5 |
| Over | 130 | 5.5 | 4.6 | 4.6 |
| Most over | 130 | 8.3 | 5.0 | 5.3 |
How to use expected TDs in fantasy decisions
When two players have similar projected opportunity, give less weight to the one whose prior production depended more on outlier conversion. Do not mechanically fade elite volume, and do not turn a historical baseline into a current ranking without team, quarterback, health, and market context.
Regress the conversion. Preserve the opportunity. Then update both for the player’s current environment.
Compare any receiving season with the same expected-touchdown baseline used in this study.
METHODS · SOURCES · REVIEW TRAILOpen the Research File+
QUESTION
Does an opportunity-based expected-touchdown baseline predict next-season receiving touchdowns better than the player’s prior raw total?
METHOD
- WR/TE seasons with at least 40 targets; expanding-window tests begin in 2018.
- Ridge regression uses targets, receptions, yards, air yards, and receiving first downs.
- Paired forecast errors use 5,000 bootstrap samples for uncertainty.
- Every source and generated artifact is hashed in the run manifest.
LIMITS
- The evaluation includes volume survivors: 649 of 1078 predictions became evaluable next-season pairs.
- Season totals omit route, red-zone, quarterback, and changing-team context.
- The result is predictive, not a causal estimate of touchdown skill.
- The public snapshot ends with 2025 and is not a current ranking model.
SOURCES
- nflverse legacy player statsCC BY 4.0 (nflverse compilation; underlying NFL data retain owner terms)
SHA-256 45b06f7b7c88cf8338b239653eeb8063c0d4e4cd814de6f13d55e9ab88101de7 - nflverse 2025 regular-season player statisticsCC BY 4.0 (nflverse compilation; underlying NFL data retain owner terms)
SHA-256 aaa8559478dd8d58569c93e278239e70e9411e79ee649c99d8d506030cd42b12
DOWNLOADABLE DATA
REVIEW TRAIL
Statistics and figures are deterministic. The public run bundle records the review mode and publication decision.